
[op_liveeditor_element data-style=””]
LESSON: Value Area – Pullback or Rotation Into a Price Flip Support / Resistance
[/op_liveeditor_element]
[op_liveeditor_element data-style=””][text_block style=”style_1.png” align=”left” font_size=”16″ font_font=”Montserrat”]This can be one of the highest probability trade setups and also one of the best bread and butter setups for price action traders to learn and trade.
You will find I will be spotting these and posting them in the forum and student summaries for students for that exact reason I have just mentioned.
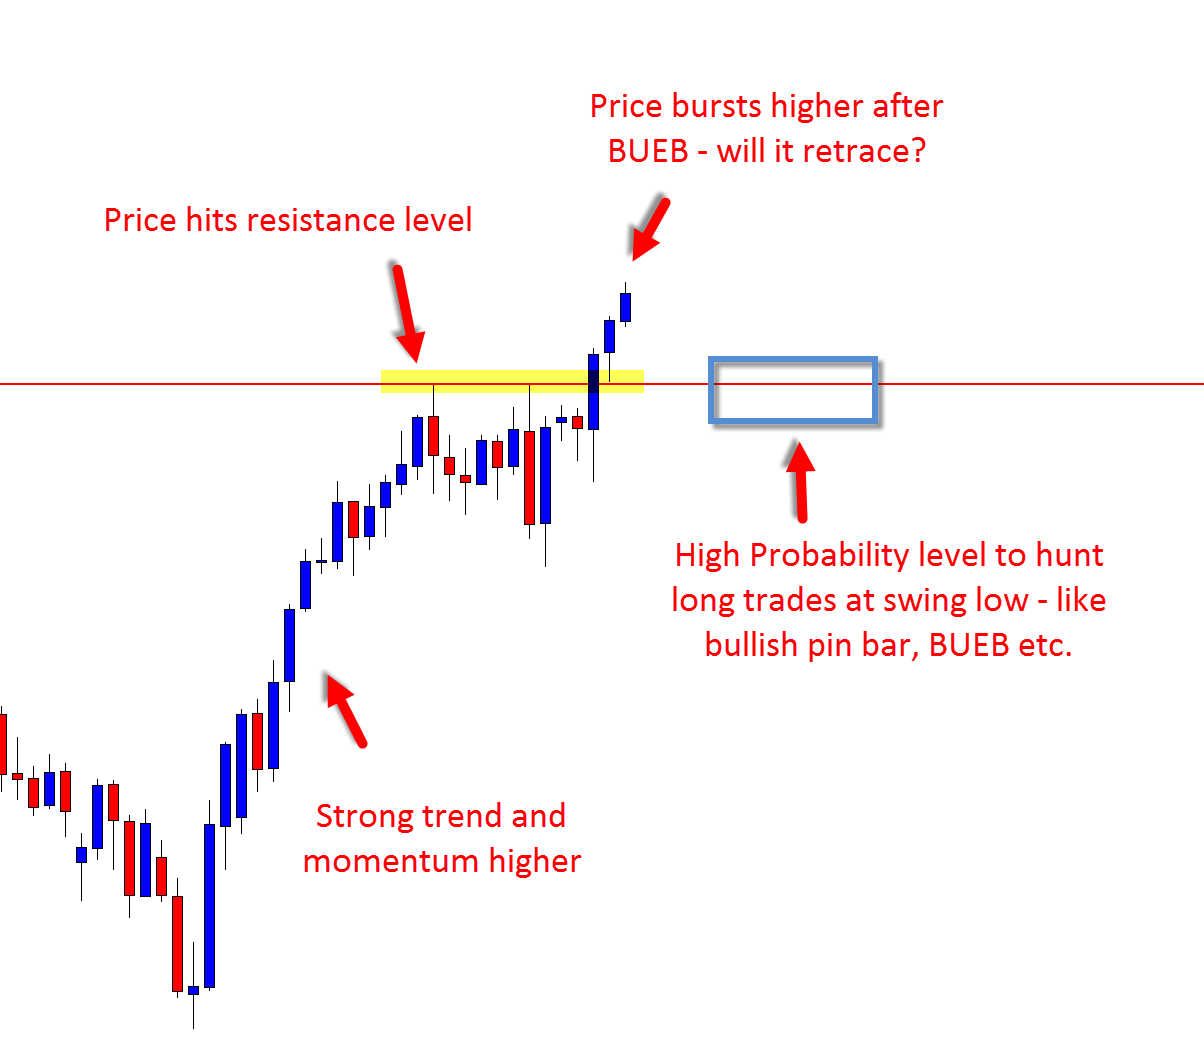
These levels are often;
- With a recent strong breakout or momentum higher or lower and so if we are making a trade at the swing high or swing low we will be both trade at a correct swing point, but also with recent momentum in our favor.
- We will often be trading at a ‘first re-test’ level. Price can often make the strongest rejection of the first re-test. (Don’t let this stop you from looking and hunting trades at 2nd/3rd/4th test though.)
- They form over and over again and after we have marked on our daily chart we can move to our smaller time frame to create space to create the swing point (take note of this last point)
On the chart below you will note that price has started a large breakout higher on a daily chart.
If I was going through my own personal summary this would be level I would definitely mark out as a level to keep a close eye on for price to potentially move back into or ‘rotate / retrace’ back into so I could make a reversal trade from.
With these types of really high probability levels, there are two ways to play them. Sometimes there will not be enough space to make a reversal trade.
When price pulls back and moves into this major level and it is inline with the recent momentum, often price on the daily chart will be making a short sharp rotation back into value before continuing.
However; we want to make a value entry at the major daily support/resistance level.
We can keep the daily level marked and start checking the smaller intraday time frames like the 8 hr, 4 hr or even smaller 1 hr, 30 minute charts, etc., because the smaller the time frame, the bigger the space and the bigger the swing point reversal will be at this same daily level.
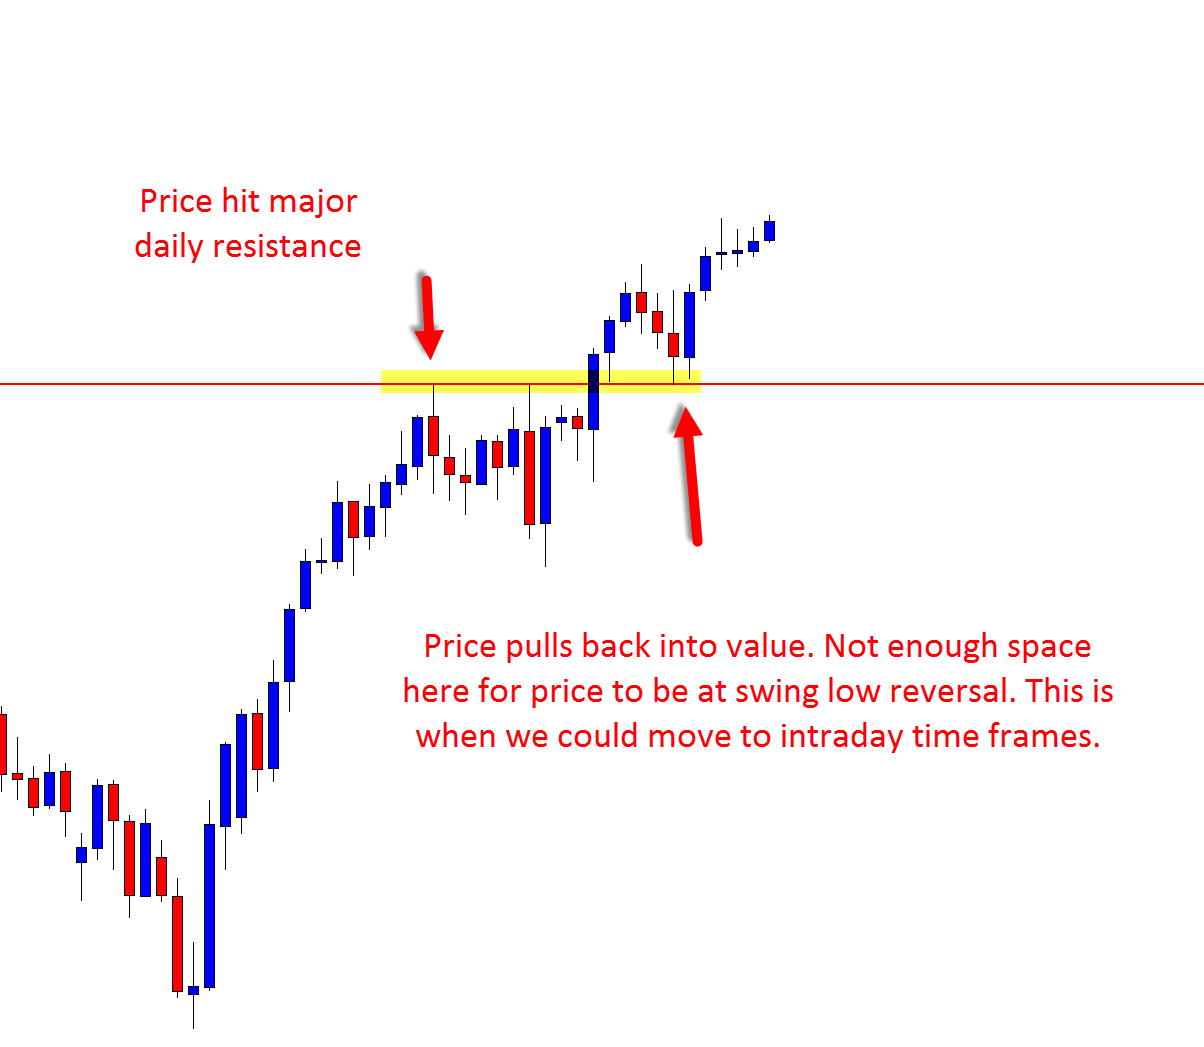
Refer to previous modules video if you missed how to make intraday entries on daily charts.
[/text_block][/op_liveeditor_element]
[op_liveeditor_elements][/op_liveeditor_elements]
[op_liveeditor_element data-style=””]

[/op_liveeditor_element]
[op_liveeditor_element data-style=””][text_block style=”style_1.png” align=”center” font_size=”25″ font_font=”Source%20Sans%20Pro” font_style=”bold”]
Module Five
[/text_block][/op_liveeditor_element]
[op_liveeditor_elements][/op_liveeditor_elements]
[op_liveeditor_element data-style=””][text_block style=”style_1.png” align=”left” bottom_margin=”10″]Duration: 12 mins[/text_block][/op_liveeditor_element]
[op_liveeditor_element data-style=””][text_block style=”style_1.png” align=”left” bottom_margin=”10″]Module Progress:[/text_block][/op_liveeditor_element]
[op_liveeditor_element data-style=””]
[/op_liveeditor_element]
[op_liveeditor_element data-style=””]
[/op_liveeditor_element]
[op_liveeditor_element data-style=””][text_block style=”style_1.png” align=”center” top_padding=”6″]« Previous Lesson[/text_block][/op_liveeditor_element]
[op_liveeditor_elements][/op_liveeditor_elements]