
[op_liveeditor_element data-style=””]
LESSON: Using Key Areas to Manage a Trade
[/op_liveeditor_element]
[op_liveeditor_element data-style=””][text_block style=”style_1.png” align=”left” font_size=”16″ font_font=”Montserrat” font_color=”%237e7e7e”]Protecting our trading capital is super important in the Forex markets, but we must also know how to manage a trade to squeeze out the maximum profit the best we can.
The way traders manage their trades will depend on their trading personality, the way the market is set up before the trade and their risk profile. The basics on how to manage trades is all the same no matter what type of trader you are.
To manage our trades we use the FSA and FRA principles and we target areas where price is likely to turn around.
Once price moves into the FRA/FSA the trader may move their trade into what is called a ‘Break Even’ position. When we refer to a breakeven position we are referring to a ‘no loss’ position or that if price was to now move back against us and take out the stop, the trader would not be winning, they would not be losing, but they would just be ‘breaking even’.
This breakeven position is normally where our entry price originally was.
Scenario Example…
For example; trader Joe entered a bullish pin bar with an entry of 1.02 and stop of 0.92. Price moved higher into the first resistance area at 1.10 (FRA). At this FRA Joe moved the stop into break even (BE) which for this example is 1.02. After hitting the FRA price collapsed and Joe was taken out at break even.
To take profit you should be targeting logical levels in the market that have been plotted BEFORE you have entered the trade. Once again it is all about keeping things simple, logical and consistent and then being able to repeat it time and time again.
There are many different ways to manage the same one trade.
There is not one right or wrong answer when it comes to trade management and this is why the good decision making traders who make the same consistent and rule based trade management decisions come out far above the others who are flying by and making up their management each trade setup – which is most.
What is super important however is that the individual trader has their own plans and keeps to their plans. Consistency is the key with trade management and this will show with your results.
If you manage trades differently each time you are in them, then your results are going to reflect this. If you want your results to be consistent, then you need a plan and you need to consistently manage your trades the same way. This is also why we have a clearly defined price action trade management plan.
The Fourth Option is an Option As Long as You Don’t IGNORE IT!!
As discussed above when price moves into the first level, traders have four options with the fourth option being to do nothing. This option is the riskiest of all of the options and the option most likely to end in the trader losing capital, but also the option that will allow the traders trade to have more room to move.
There is an art to protecting capital and giving the trade room to breathe. We must first always remember; without capital we can’t trade.
There is a clear difference between identifying a FRA/FSA, acknowledging it is there and then making a conscious choice not to move to breakeven when price reaches it and not having the knowledge and education to be able to identify it or even worse being able to identify the first area and just pretending it is not there.
What will determine these decisions is the price action story or the context of what the price action forms in.
For example; a huge pin bar that forms in a very strong trend rejecting a key level, has a lot higher chance of moving straight through the FRA/FSA level than a tiny pin in the middle of nowhere and against the trend.
The other factor is also how strong the FRA/FSA level is itself. Is the level just a couple of candle highs or lows? Or is it a full proven previous support and resistance level? Everything to do with the price action story and the context of the story that has already been taught in the course should be taken into account and considered.
From this information, you can build a trading plan to work out when they will and will not move to breakeven and exactly how they will manage their trades.
[/text_block][/op_liveeditor_element]
[op_liveeditor_element data-style=””][text_block style=”style_1.png” align=”left” font_size=”16″ font_font=”Montserrat” font_color=”%237e7e7e”]
Chart Scenarios Examples Managing Trade Setups
The best way to explain managing trades is by using rolling charts as different examples.
These chart examples are just an example to show you how these levels work.
You now understand your options when price reaches these levels and you understand what you should be doing.
You have been taught what the FSA/FRA’s are and you also understand major support and key price flip levels.
These next charts are to show you examples on an extended chart of how you could look to possibly manage them yourself. After these examples we are going to go through how to make a pre-trading plan and then look at more in-depth trading with these levels.
CHART EXAMPLE #1:
The trade trigger is the large Bearish False Break Pingulfing Bar at a swing high.
If price can break and make a move below the low of the pingulfing bar, then there is a lot of space to move into before we would hit the First Support Area.
If price does move lower into this support level we could;
- Take full profit
- Take partial profit and move our stop to breakeven, or leave stops where they are
- Move our stop to breakeven and look for bigger profits
- Nothing
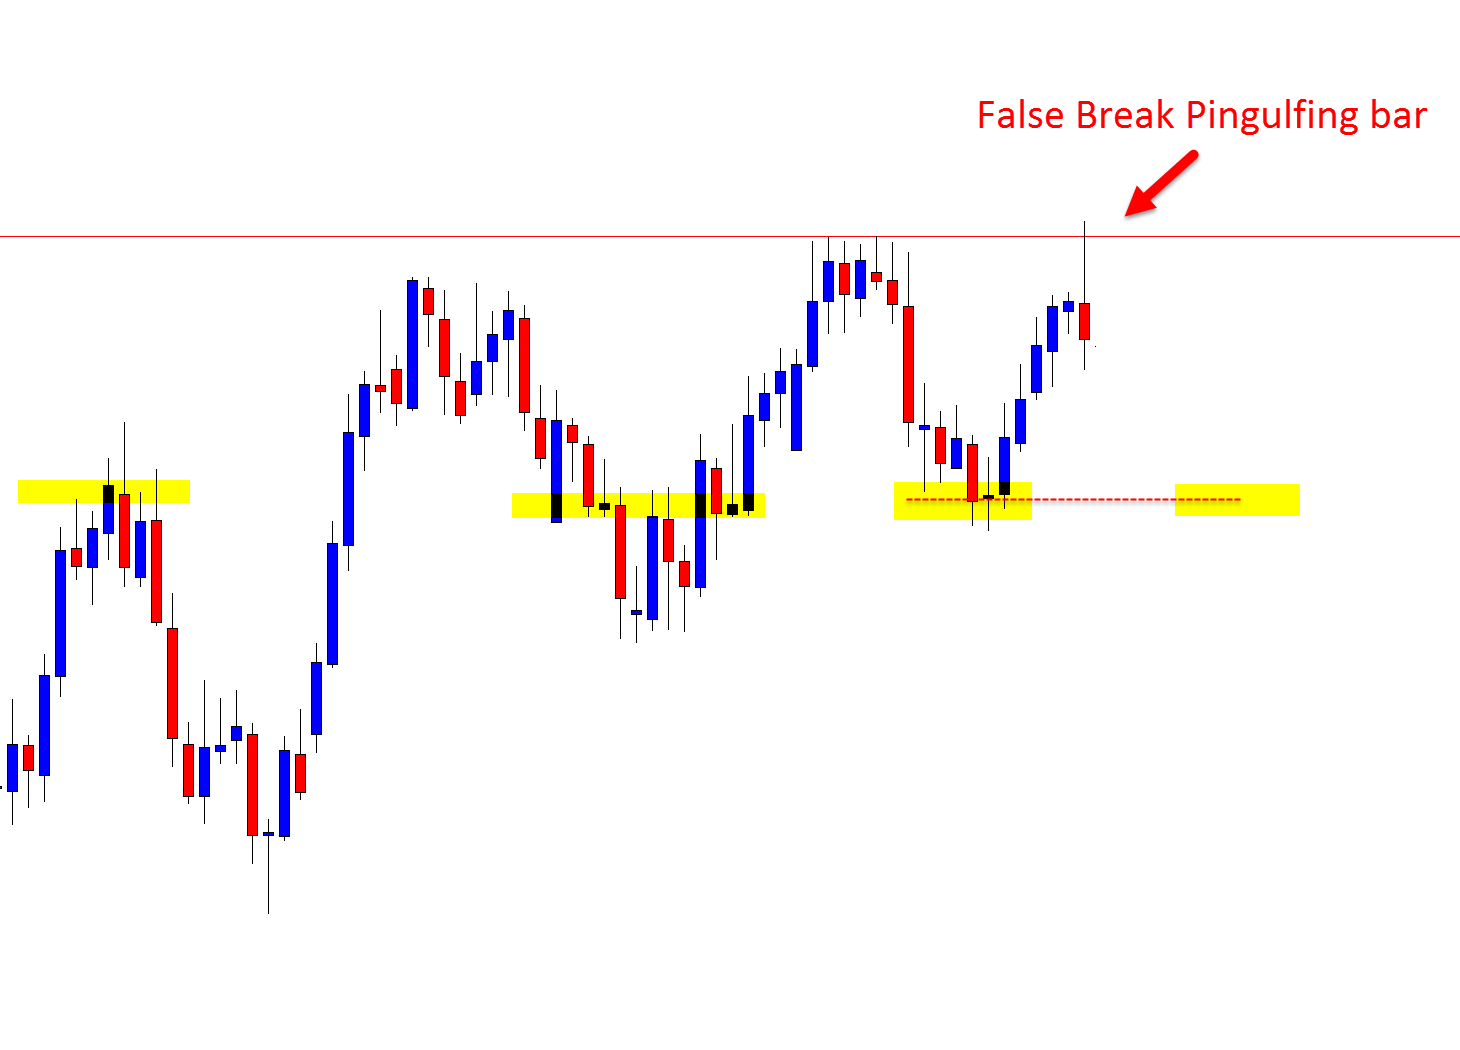
CHART EXAMPLE #2:
After you have selected your trade management option, you enter you trade and price makes it’s move and in this case just like magic it moves lower into the FSA. Now… comes crunch time.
What to do? You carry out the first part of the plan i,e take profit target #1 and move to breakeven or move stops down to breakeven etc, and then what?
Do you have a second profit target? or a third profit target?
Do you plan to leave you stops above the high for the whole trade? Or, if price does move lower, will you move your stops inline with your targets?
This is where having a pre-trade plan is crucial. Your skill with these price flip and S/R levels will develop and help you overtime especially when setting targets.
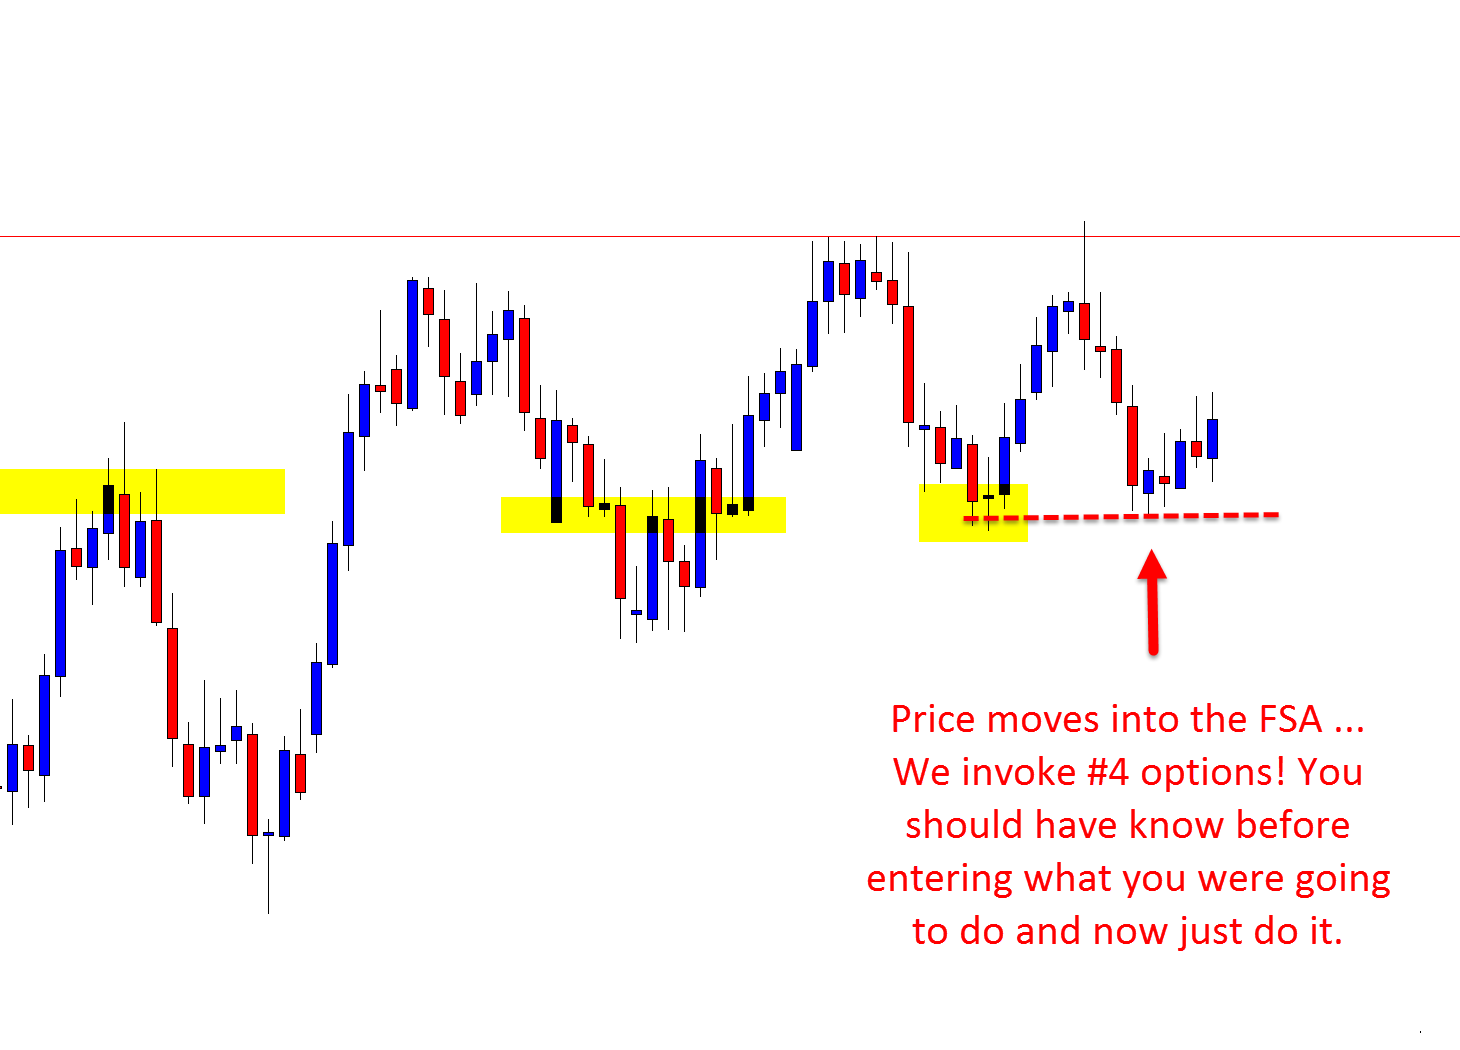
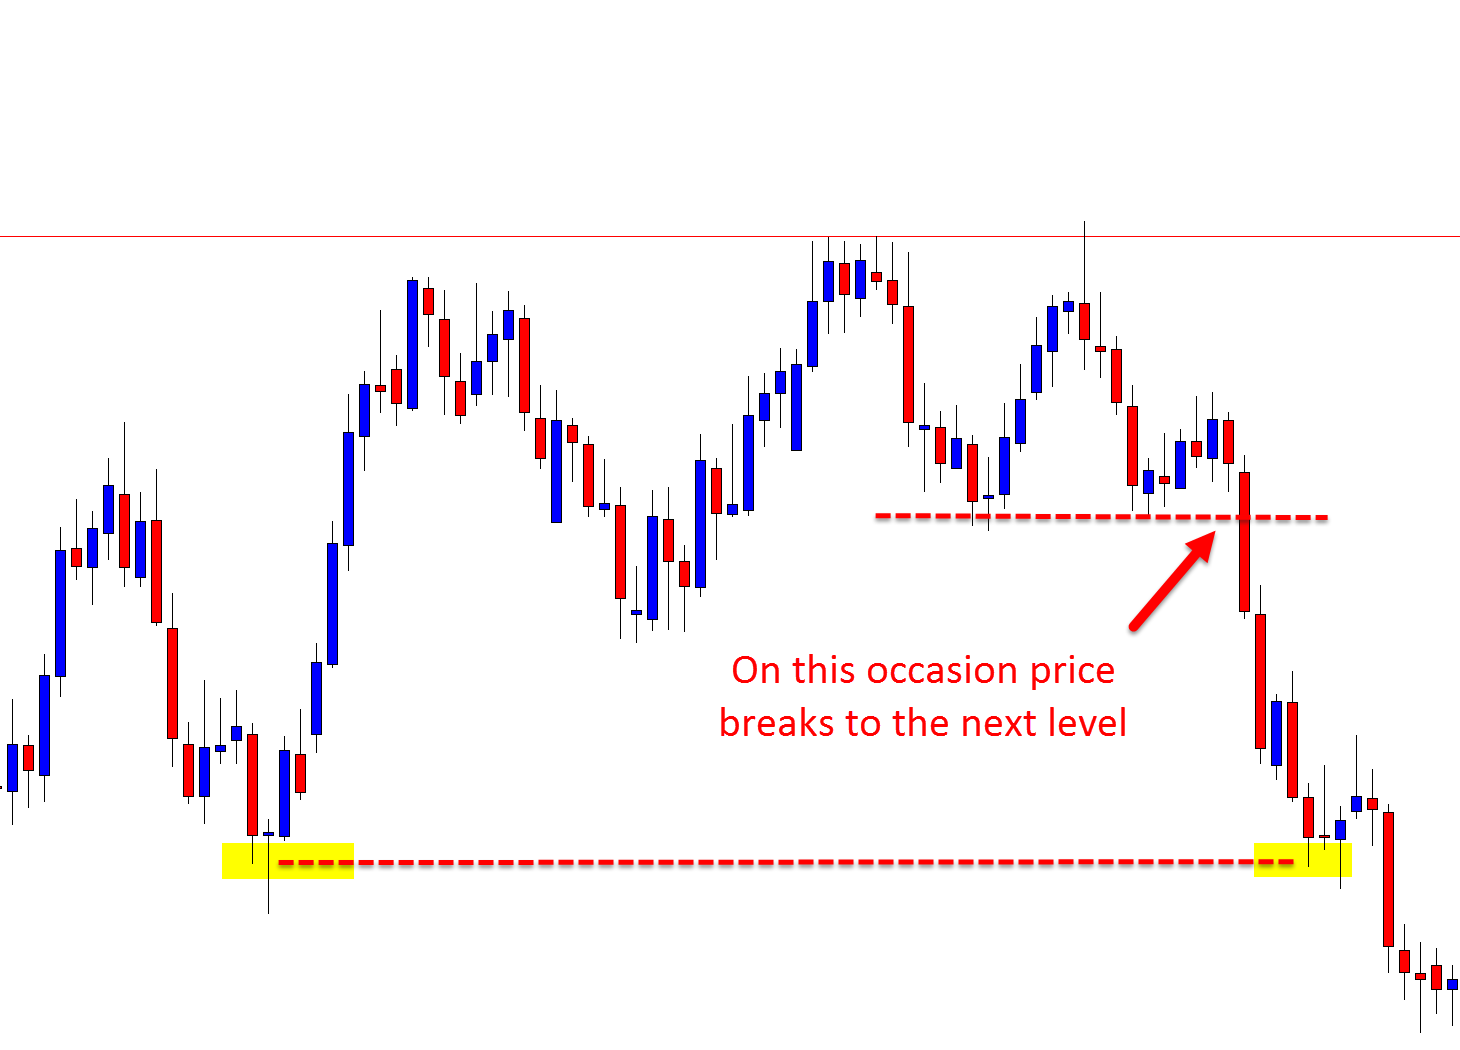
CHART EXAMPLE #3:
With this scenario price ended up breaking lower, however; with a lot of markets that are as sideways as this one was price will move into the first level and make a rebound / rejection.
It is not a profitable business to ‘hope’ and hold out looking for levels to break.
However, the reason I have this example is because if you were in this trade, then you would most likely have your stop loss at a breakeven position AND have banked some profit when you were looking for this level to break.
That is a completely different story to making a trade, and then looking for a level to break. If you make a trade and risk a full loss hoping a level will break you are more than often going to lose. In this example below you are only gaining more profits and a lot of them!!
 [/text_block][/op_liveeditor_element]
[op_liveeditor_element data-style=””][text_block style=”style_1.png” align=”left” font_size=”16″ font_font=”Montserrat” font_color=”%237e7e7e”]
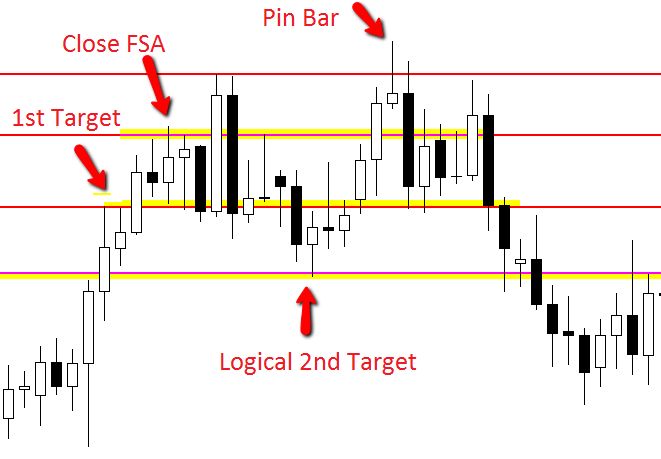
Example Scenario #2:
Bullish false break pin bar making false break of key support.
These can be very powerful setups as they get the bulk of the market breaking the wrong way. Price moved into the FRA and then straight into the logical next target, before reversing and rolling back over after forming a BEEB.
 [/text_block][/op_liveeditor_element]
[op_liveeditor_element data-style=””][text_block style=”style_1.png” align=”left” font_size=”16″ font_font=”Montserrat” font_color=”%237e7e7e”]
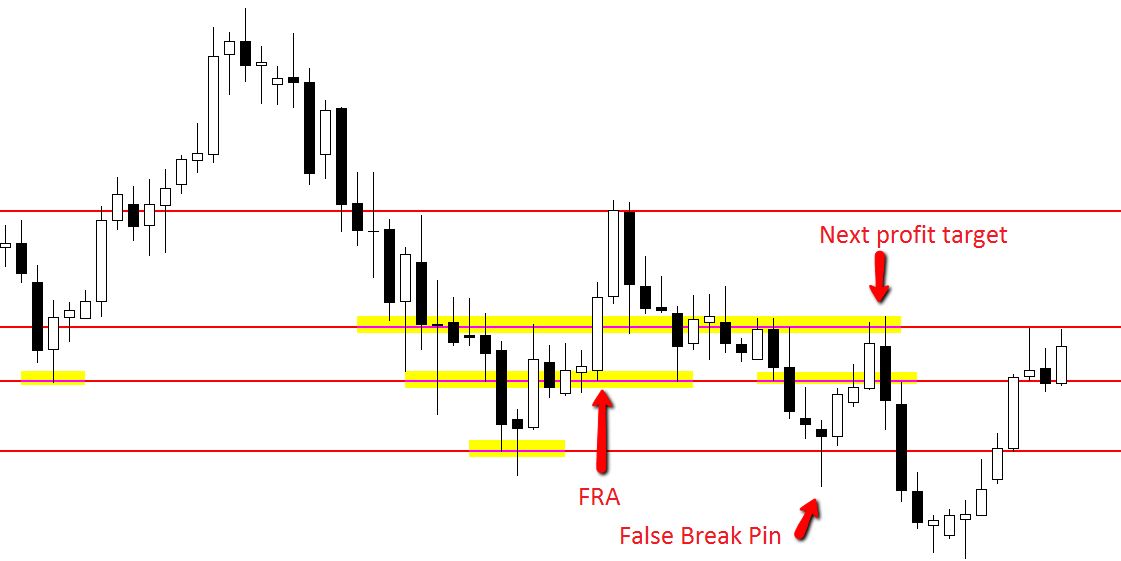
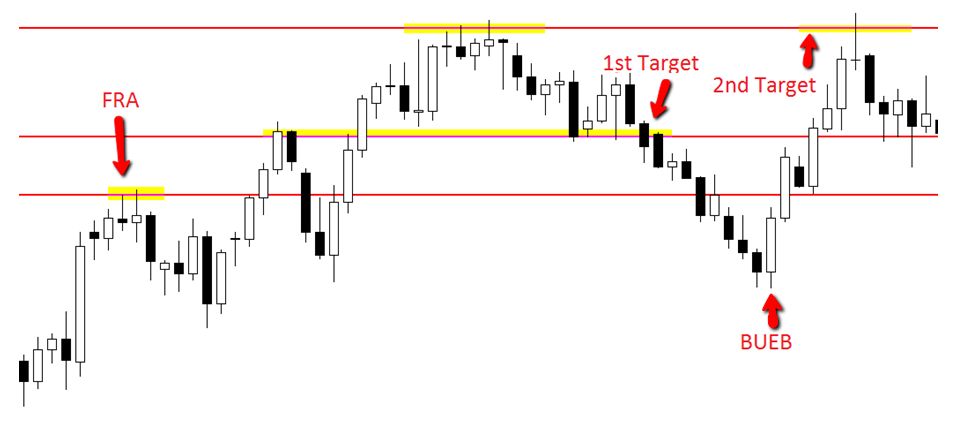
Example Scenario #3:
A bearish false break pin bar faking out of resistance.
Once again a powerful a reliable setup as the market gets faked out thinking the market is about to break out higher.
A really close FSA, but as often happens with the false breaks, once the stops of traders looking to get long start getting taken out with price moving back lower, it is like adding fuel to the fire and price can gain momentum pretty quickly.
Price moved straight through the FSA and to the obvious first target and then on to the next level.
 [/text_block][/op_liveeditor_element]
[op_liveeditor_element data-style=””][text_block style=”style_1.png” align=”left” font_size=”16″ font_font=”Montserrat” font_color=”%237e7e7e”]
Example Scenario #4:
Large BUEB with close FRA. Once this FRA was broken, price gained momentum and could have been managed using the logical price action levels.
[/text_block][/op_liveeditor_element]
[op_liveeditor_elements][/op_liveeditor_elements]
[op_liveeditor_element data-style=””]

[/op_liveeditor_element]
[op_liveeditor_element data-style=””][text_block style=”style_1.png” align=”center” font_size=”25″ font_font=”Source%20Sans%20Pro” font_style=”bold”]
Module Ten
[/text_block][/op_liveeditor_element]
[op_liveeditor_elements][/op_liveeditor_elements]
[op_liveeditor_element data-style=””][text_block style=”style_1.png” align=”left” bottom_margin=”10″]Duration: 35 mins[/text_block][/op_liveeditor_element]
[op_liveeditor_element data-style=””][text_block style=”style_1.png” align=”left” bottom_margin=”10″]Module Progress:[/text_block][/op_liveeditor_element]
[op_liveeditor_element data-style=””]
[/op_liveeditor_element]
[op_liveeditor_element data-style=””]
[/op_liveeditor_element]
[op_liveeditor_element data-style=””][text_block style=”style_1.png” align=”center” top_padding=”6″]« Previous Lesson[/text_block][/op_liveeditor_element]
[op_liveeditor_elements][/op_liveeditor_elements]
[op_liveeditor_element data-style=””]
Action Steps & Downloads / Links
[/op_liveeditor_element]
[op_liveeditor_element data-style=””]

Watch Video
[/op_liveeditor_element]
[op_liveeditor_elements][/op_liveeditor_elements]