
[op_liveeditor_element data-style=””]
LESSON: Stops on the Pingulfing Bar
[/op_liveeditor_element]
[op_liveeditor_element data-style=””][text_block style=”style_1.png” align=”left” font_size=”16″ font_font=”Montserrat” font_color=”%237e7e7e”]The majority of stop placements should be placed on the other side of the Pingulfing Bar.
For example; if we are entering a Bearish Pingulfing Bar at the break lower, we should have our stop at the other side of the high of the Pingulfing Bar.
Placing the stop this way is not always practical because the stop on occasions can get very large and we must always enter at the break of the high or low.
On occasion we can use 2 different ways to shorten the stop which are:
- Using the 70% area
- Using Surrounding Support and resistance
Using the 70% Area
Similar to the Pin Bar on occasions we can use the 70% area of the Pingulfing bar as our stop loss point.
This should only be done when the Pingulfing Bar is really huge.
The chart below shows a really large Bearish Pingulfing Bar.
Here we could use the 70% area for our stops.
Chart Example #1:
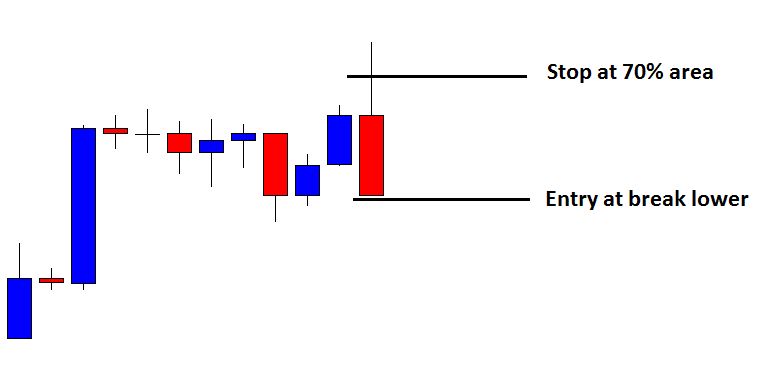
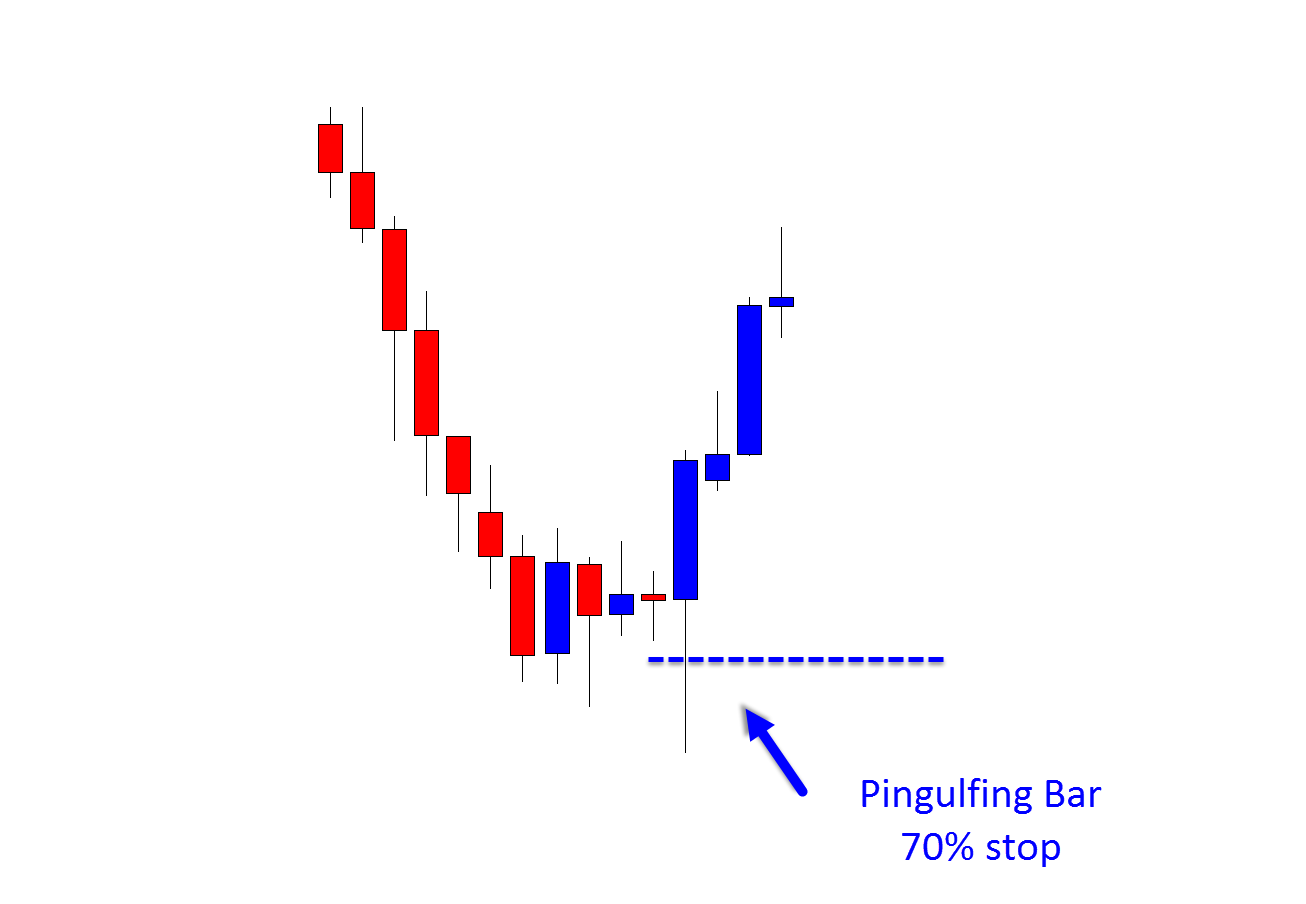
Chart Example #2:
Using Surrounding Support and Resistance
On some Pingulfing Bar trades there will be surrounding support and resistance we can use as a buffer between our stop level and the current price. When using this method what we are trying to do is place our stop above or below a support or resistance area that price would have to break before taking us out of a trade.
The idea behind this method is that the support or resistance will hopefully hold and we will be left in the trade. If we do get stopped out because price has broken through the support or resistance and reached our stop, the chances are that the stop above the high or low would also have been taken out.
To explain this stop method further and how to use it I have attached some charts below.
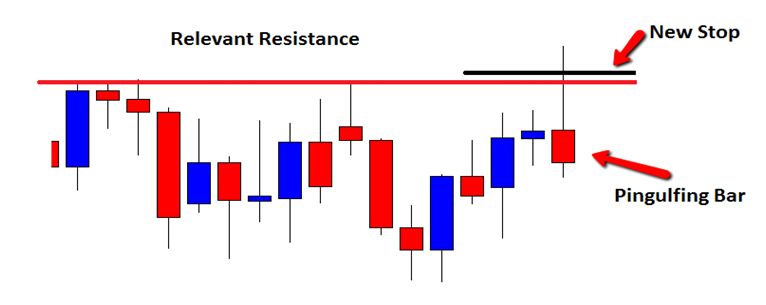
Chart Examples
This example was a Bearish Pingulfing Bar. To the left of the trade we had a recent resistance level. I have marked this resistance level in red.
When looking at this trade we would identify this level and instead of placing the stop above the high we may choose to place our stop just above this resistance area.
I have marked the new stop area in black. Our trade risk reward would now be increased and our stop would have a buffer from current price in the way of a resistance level.
Chart Stop Example #1:
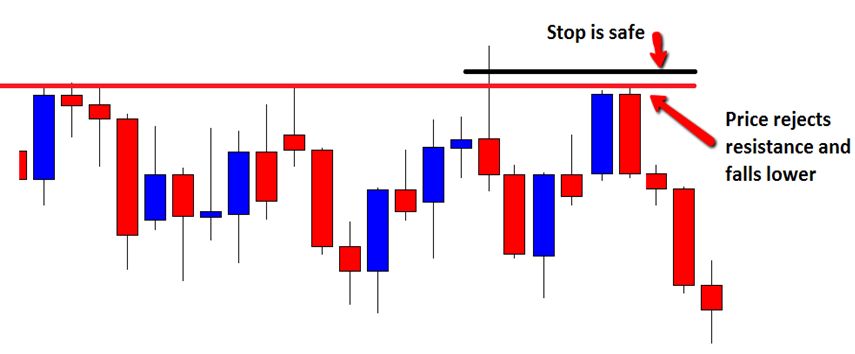
Price does break lower and open our pending orders to go short. Price then begins retracing up towards our stop level. Price hits this resistance level and rejects it before falling much lower again. In this example our stop would not have been touched and we would have remained in the trade. We increased our risk reward and managed the stop smartly.
Chart Stop Example #2:
Please make sure you work out what stop method is best for you and your type of trading personality. Once you have worked this out it is vital that you put it into your trade plan. Your trade plan should cover exactly how you manage stops in all trade types and what rules you have for managing stops.
Stops cannot just be used randomly. If you place stops at random, expect your trading results to be random.
I have made a Trading Plan example for members only that will help you work all this out. Please read it and then get about creating your own![/text_block][/op_liveeditor_element]
[op_liveeditor_elements][/op_liveeditor_elements]
[op_liveeditor_element data-style=””]

[/op_liveeditor_element]
[op_liveeditor_element data-style=””][text_block style=”style_1.png” align=”center” font_size=”25″ font_font=”Source%20Sans%20Pro” font_style=”bold”]
Module Eight
[/text_block][/op_liveeditor_element]
[op_liveeditor_elements][/op_liveeditor_elements]
[op_liveeditor_element data-style=””][text_block style=”style_1.png” align=”left” bottom_margin=”10″]Duration: 10 mins[/text_block][/op_liveeditor_element]
[op_liveeditor_element data-style=””][text_block style=”style_1.png” align=”left” bottom_margin=”10″]Module Progress:[/text_block][/op_liveeditor_element]
[op_liveeditor_element data-style=””]
[/op_liveeditor_element]
[op_liveeditor_element data-style=””]
[/op_liveeditor_element]
[op_liveeditor_element data-style=””][text_block style=”style_1.png” align=”center” top_padding=”6″]« Previous Lesson[/text_block][/op_liveeditor_element]
[op_liveeditor_elements][/op_liveeditor_elements]
[op_liveeditor_element data-style=””]
Action Steps & Downloads / Links
[/op_liveeditor_element]

[op_liveeditor_elements][/op_liveeditor_elements]