
[op_liveeditor_element data-style=””]
LESSON: Reading the Price Action Story
[/op_liveeditor_element]
[op_liveeditor_element data-style=””][text_block style=”style_1.png” align=”left” font_size=”16″ font_font=”Montserrat” font_color=”%237e7e7e”]This next part of the course on price consolidating and winding up is not to help traders make trades, but rather to help them read the overall Price Action story.
A trader needs knowledge not only on how to make and manage trades, but also the types of markets and the habits price tends to repeat.
Price is only ever doing three things which are:
- Moving higher
- Moving Lower
- Consolidating
Learning how to identity how the markets move and operate will increase a trader’s knowledge on what they can expect to happen in the markets. As we know all a candle simply represents is what humans are doing in a form that we can read on a chart.
The difference between price ranging and consolidating
Markets are ranging when they are continually bouncing from on level back to the next and so on. When price is consolidating it is simply taking a breather, before either continuing on or changing direction. When a market is consolidating it is getting ready to either continue in the original direction or change directions.
A trader can use this knowledge to either manage their trades or to identify a possible trade. Knowing or being able to identify what the market is doing can also be crucial in helping a trader stay away from low probability trades.
If a trader can read price and follow the clues, they could keep themselves out of undesirable markets like the consolidating market.
For example; when a trader notices that price is moving into consolidation, they would be best served by sitting on the sidelines and waiting for the market to break out either higher or lower.
By doing this the trader won’t be caught out by either false breaks or the market whipping in between the consolidation range.
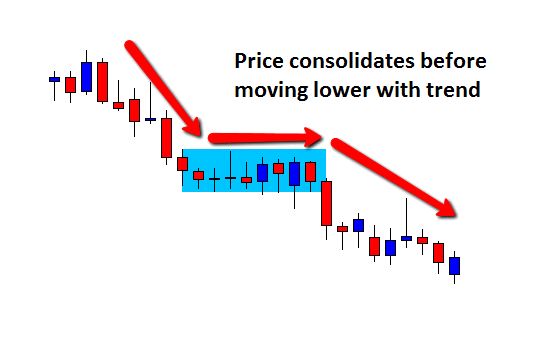
An example of a market consolidating is below. Notice price moved lower before stalling. The market stalled and consolidated before moving lower. If a trader was short here they would be able to read the price and see that price was consolidating and getting ready for the big push lower.
Price will 70% of the time break out of the consolidation in the direction of the trend before it moved into consolidation.
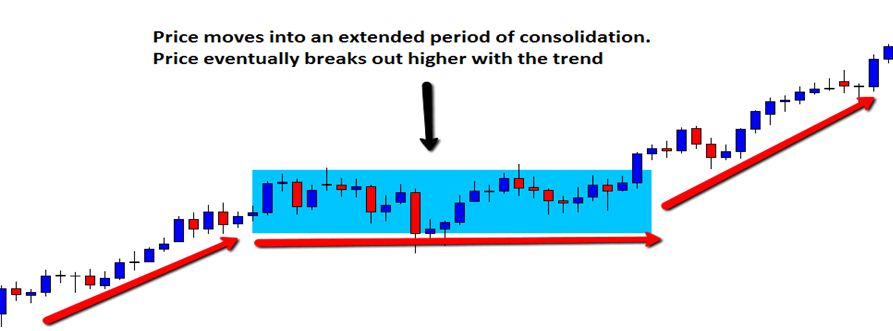
The example chart below shows price moving higher in an uptrend. Price moves into an extended time of consolidating.
Note that it would be very important for a trader to be able to read this because upon noticing the market had moved into consolidation the trader could sit aside and wait for the market to play its hand. By doing this the trader won’t get caught out, by trading false breaks.
Price eventually does break out higher and the trader could again look for long trades to join the trend. Remember price breaks out with the original trend direction 70% of the time!
Price Winding up
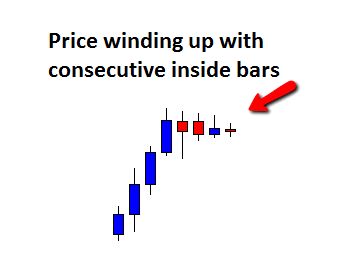
Sometimes in this consolidation phase price will begin winding up. Price winds up by forming consecutive inside bars with each candle having smaller ranges. This can be a very important pattern to identify.
Price winding up is price getting ready to explode. The more candles that go into making the windup the bigger and faster the likely breakout will be.
An example of price winding up is below:
When we start to see price winding up we know that a breakout is coming. We also know price will break out in the direction of the trend before the windup 70% of the time. Keeping this in mind we can begin to look for trades.
Trading a straight breakout is not a very smart play. Quite often traders will be stopped out by the market making a false break.
The smartest play is to wait for these traders to be stopped out and then jump on the price when it is moving in the opposite direction. For more on false breaks and how to make false break trades please read the “False Break” section later on in the course.
[/text_block][/op_liveeditor_element]
[op_liveeditor_elements][/op_liveeditor_elements]
Hunting A+ Trades Within the Price Action Story
[/text_block]
[/custom_html][/op_liveeditor_element]
[op_liveeditor_elements][/op_liveeditor_elements]
[op_liveeditor_element data-style=””]

[/op_liveeditor_element]
[op_liveeditor_element data-style=””][text_block style=”style_1.png” align=”center” font_size=”25″ font_font=”Source%20Sans%20Pro” font_style=”bold”]
Module Three
[/text_block][/op_liveeditor_element]
[op_liveeditor_elements][/op_liveeditor_elements]
[op_liveeditor_element data-style=””][text_block style=”style_1.png” align=”left” bottom_margin=”10″]Duration: 30 mins[/text_block][/op_liveeditor_element]
[op_liveeditor_element data-style=””][text_block style=”style_1.png” align=”left” bottom_margin=”10″]Module Progress:[/text_block][/op_liveeditor_element]
[op_liveeditor_element data-style=””]
[/op_liveeditor_element]
[op_liveeditor_element data-style=””]
[/op_liveeditor_element]
[op_liveeditor_element data-style=””][text_block style=”style_1.png” align=”center” top_padding=”6″]« Previous Lesson[/text_block][/op_liveeditor_element]
[op_liveeditor_elements][/op_liveeditor_elements]
[op_liveeditor_element data-style=””]
Action Steps & Downloads / Links
[/op_liveeditor_element]
[op_liveeditor_element data-style=””]

Watch Video
[/op_liveeditor_element]
[op_liveeditor_element data-style=””]

Complete Module Test
[/op_liveeditor_element]

[op_liveeditor_elements][/op_liveeditor_elements]