
[op_liveeditor_element data-style=””]
LESSON: Price Flipping from Support to Resistance and Vice Versa
[/op_liveeditor_element]
[op_liveeditor_element data-style=””][text_block style=”style_1.png” align=”left” font_size=”16″ font_font=”Montserrat” font_color=”%237e7e7e”]One very common and useful principle of the Forex markets is support and resistance price flips.
Price in the Forex markets will often bounce between support and resistance, and when it breaks a key level the price flips from being old support to new resistance, or the opposite from old resistance to new support.
This is a fundamental market principal in Forex markets and whilst it may seem simple it can at times be tricky. A key to these is making them on your daily charts, and then if you are making trades on your smaller intraday charts you will see price respecting the same price flip level.
For example; if price breaks and moves out of a resistance level higher, we could watch this level to see if it becomes a new support price flip level on the daily or smaller intraday time frame.
NOTE: I discuss these live levels (as well as all major levels) in the Student Price Action Summary.
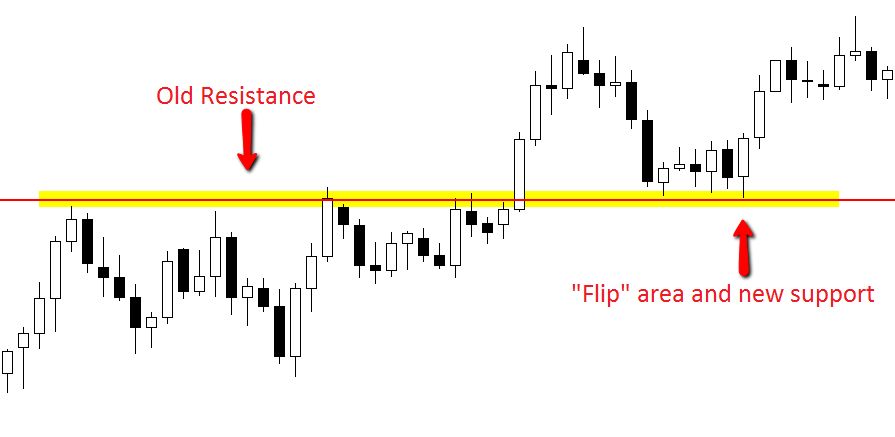
These areas that turn from being old support to new resistance and vice versa are known as price flip points and some traders know them as role reversal areas.
Basically they are a key area where price has changed from being either support or resistance and price has “flipped”.
See the charts below for further explanation:
Chart Example #1:
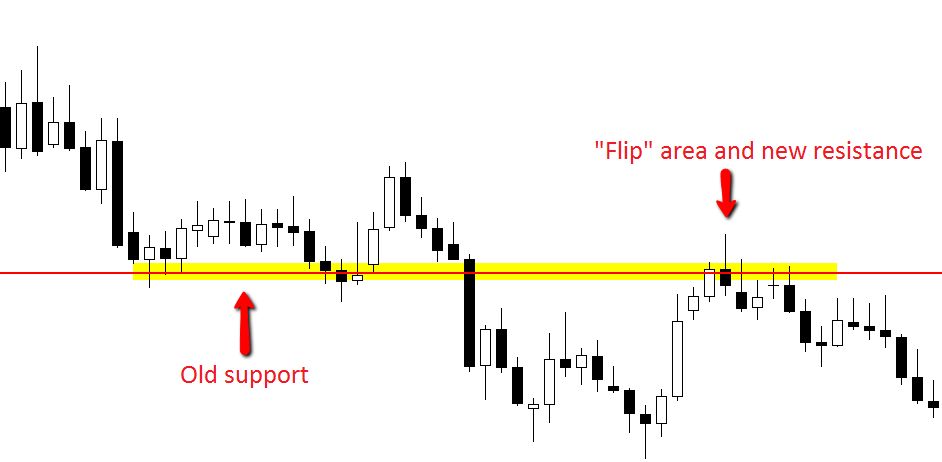
Chart Example #2:
 [/text_block][/op_liveeditor_element]
[op_liveeditor_elements][/op_liveeditor_elements]
[op_liveeditor_element data-style=””]

[/op_liveeditor_element]
[op_liveeditor_element data-style=””][text_block style=”style_1.png” align=”center” font_size=”25″ font_font=”Source%20Sans%20Pro” font_style=”bold”]
Module Four
[/text_block][/op_liveeditor_element]
[op_liveeditor_elements][/op_liveeditor_elements]
[op_liveeditor_element data-style=””][text_block style=”style_1.png” align=”left” bottom_margin=”10″]Duration: 3 mins[/text_block][/op_liveeditor_element]
[op_liveeditor_element data-style=””][text_block style=”style_1.png” align=”left” bottom_margin=”10″]Module Progress:[/text_block][/op_liveeditor_element]
[op_liveeditor_element data-style=””]
[/op_liveeditor_element]
[op_liveeditor_element data-style=””]
[/op_liveeditor_element]
[op_liveeditor_element data-style=””][text_block style=”style_1.png” align=”center” top_padding=”6″]« Previous Lesson[/text_block][/op_liveeditor_element]
[op_liveeditor_elements][/op_liveeditor_elements]
[op_liveeditor_element data-style=””][text_block style=”style_1.png” align=”center” font_size=”16″ font_font=”Montserrat” font_color=”%237e7e7e” bottom_margin=”8″]Action Steps & Downloads / Links[/text_block][/op_liveeditor_element]

[op_liveeditor_elements][/op_liveeditor_elements]