
[op_liveeditor_element data-style=””]
LESSON: How to Mark Support and Resistance Levels
[/op_liveeditor_element]
[op_liveeditor_element data-style=””][text_block style=”style_1.png” align=”left” font_size=”16″ font_font=”Montserrat” font_color=”%237e7e7e”]Marking Support and Resistance levels should not be a complicated exercise.
When marking your profits and stops you need to be precise because if you miss your profit target by a pip price can turn around and you miss your profit, but support and resistance are not precise.
They are zones or levels – NOT exact lines. To answer a common question, how far back do you go? You take into account all the levels from right in front of you to 20 years ago because the levels 20 years ago are still repeating. You can check this out right now. Go to any chart and go and have a look.
With this in mind however; keep in mind our rule; we are marking levels to make trades, not just random levels.
The Major Levels
Think of it this way: If you can see the obvious Support or Resistance level, chances are other traders in the market can as well and will be looking to use it in their trading just like you.
Everyone from the banks, to brokers to retail traders are using major support and resistance when factoring their orders.
You will often find the obvious levels will be respected a lot more often than the small and irrelevant levels and this is because of what we spoke about in the previous lesson and the big levels being big piles of buyers/sellers.
Why Trend Lines Are Not Used
We don’t use trend lines at all when marking support and resistance.
The reason for this is simple; they are far too subjective and are not reliable. I give the same chart to five traders and five traders will give me five different trend lines.
These five different traders will be able to go into the Forex market and move a trend line onto every chart to create it how they want to see it pushing points the way they want, and each of the other five will be looking for completely different levels.
This cannot be done with support and resistance. If I post 5 x Forex pairs right now into the student community and ask ANY 10 x students to mark those daily support or resistance levels, they will come up with almost the exact same levels.
The kicker is; when those traders go to make intraday trades either through reversals or advanced ‘touch trades’ as you will learn in advanced course on smaller time frames, they will all be using the same major level!
Support and resistance lines are proven and work time and time again. They have been tested and the same logical level can be seen by every trader.
No Moving Averages or Anything Else
We also do not use moving averages for either trend identification or support and resistance. All the levels we use have to be proven and logical levels.
Some traders use moving averages for what they call “dynamic” support and resistance or in other words they use the moving average or moving averages as a moving support and resistance level.
The major problem with this is: This is not a proven level and has never been tested or proven. There are no set moving average numbers.
Every different trader uses their own different moving average set that they swear by as the “golden” moving average. Some traders use the 150 ema. Some use the 150 and 365 ema’s combination. Some use a combination of the 20 and 8 ema. The point is there are no set combinations of moving averages to use.
All these traders that are using their moving averages for dynamic support and resistance with different sets of moving averages will literally be seeing support and resistance at every level on the chart.
At least one of them is going to be right because with all the different moving averages there will literally be support and resistance at every point on the chart and at least one trader will have to be correct at one time.
Remember: support and resistance levels are ‘levels’ or zones and not exact lines. Price is moving up and through, making rejections of them and not pip point precision moves.
Chart Examples
Chart example #1:
Taking our trade from the right levels is important as we want to be trading with the same direction as the big players. Trading away from these levels and not into them is a must in Forex trading.
We don’t want to be taking a trade straight into a Support or Resistance level that the big guys will be changing the direction of price from.
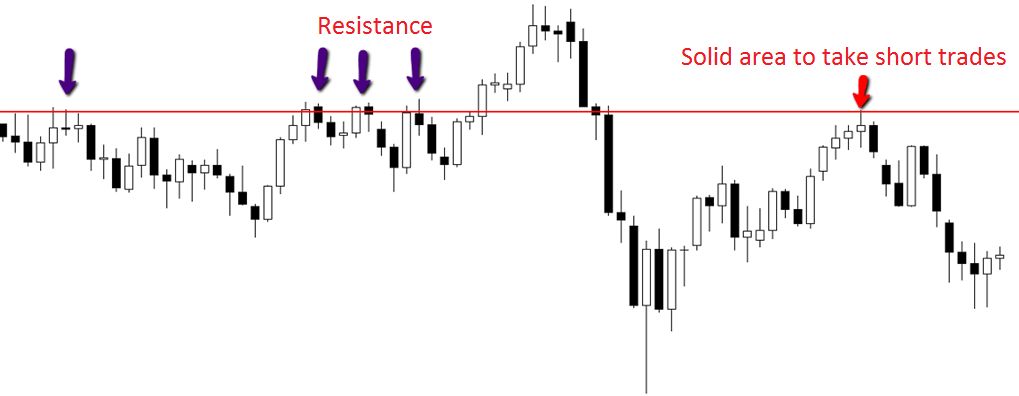
Chart example #2:
The chart below is an example of price in an uptrend on the daily chart. Price is making higher highs and higher lows with a consolidation period on the middle. The chart highlights two key support areas marked.
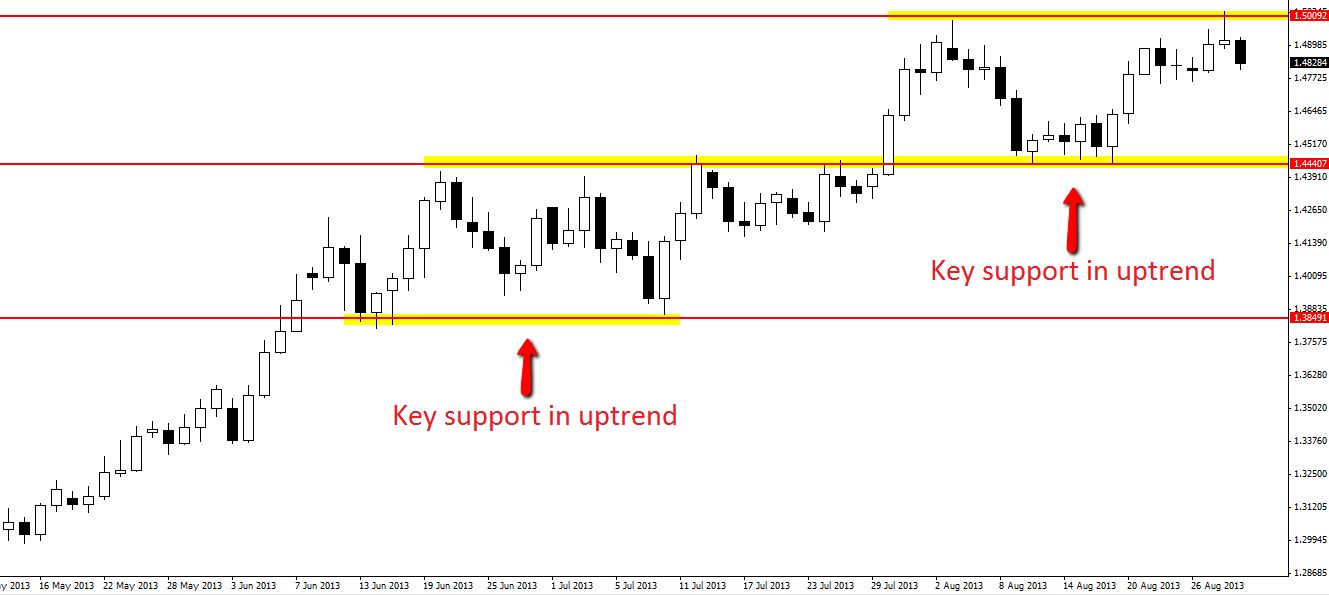
Chart example #3:
The chart below shows price in a range/consolidation period. Price had been moving higher, but has now paused, producing a clear high and low of a range.
Because price was moving higher before moving into this range period, the higher percentage play is that price will break out through the high, but as the chart shows the two key areas to make trades whilst this range holds are the key resistance and support.
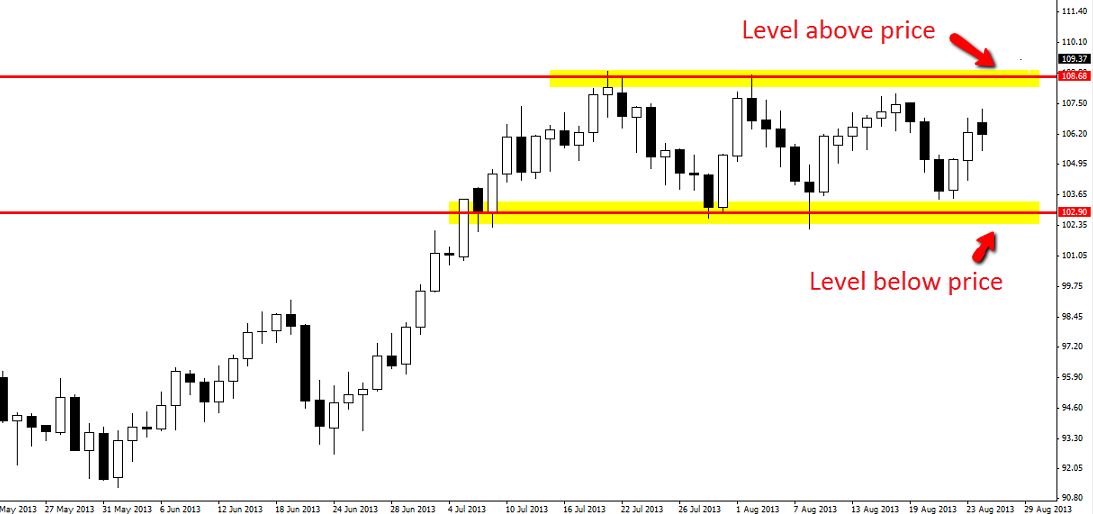
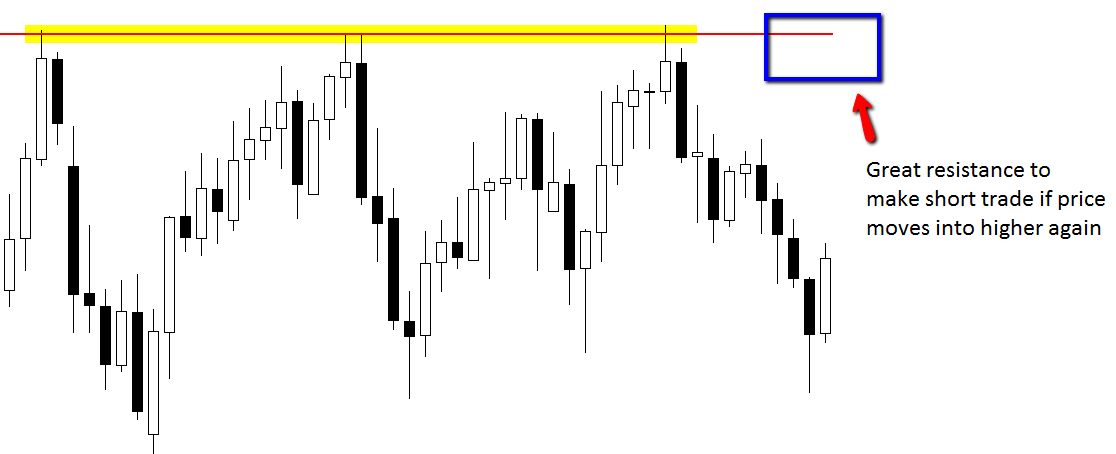
Chart example #4:
Long term Resistance that had been tested many times and held. A very good area to look for short positions the next time price hits this level.
NOTE:
Occasionally we can trade against the trend when we are trading from a very solid level and we have also lined up other factors in our favor, for example, we may have a huge false break, a lot of space, notice price starting a reversal like the base / top we have spoken about.[/text_block][/op_liveeditor_element]
[op_liveeditor_elements][/op_liveeditor_elements]
[op_liveeditor_element data-style=””]

[/op_liveeditor_element]
[op_liveeditor_element data-style=””][text_block style=”style_1.png” align=”center” font_size=”25″ font_font=”Source%20Sans%20Pro” font_style=”bold”]
Module Four
[/text_block][/op_liveeditor_element]
[op_liveeditor_elements][/op_liveeditor_elements]
[op_liveeditor_element data-style=””][text_block style=”style_1.png” align=”left” bottom_margin=”10″]Duration: 25 mins[/text_block][/op_liveeditor_element]
[op_liveeditor_element data-style=””][text_block style=”style_1.png” align=”left” bottom_margin=”10″]Module Progress:[/text_block][/op_liveeditor_element]
[op_liveeditor_element data-style=””]
[/op_liveeditor_element]
[op_liveeditor_element data-style=””]
[/op_liveeditor_element]
[op_liveeditor_element data-style=””][text_block style=”style_1.png” align=”center” top_padding=”6″]« Previous Lesson[/text_block][/op_liveeditor_element]
[op_liveeditor_elements][/op_liveeditor_elements]
[op_liveeditor_element data-style=””]
Action Steps & Downloads / Links
[/op_liveeditor_element]
[op_liveeditor_element data-style=””]

Start Marking Your Key Daily S/R Levels
[/op_liveeditor_element]
[op_liveeditor_elements][/op_liveeditor_elements]