
[op_liveeditor_element data-style=””]
LESSON: FSA – First Support Area
[/op_liveeditor_element]
[op_liveeditor_element data-style=””][text_block style=”style_1.png” align=”left” font_size=”16″ font_font=”Montserrat” font_color=”%237e7e7e”]There are two types of plans.
One is our overall trading plan that governs all our trading rules and the whole trading method.
The other is a “Pre-trading plan”. As the ‘pre’ part suggests it is created before we enter the trade to set out our trade path and profit and I will go into far more detail in an upcoming lesson very soon on this.
FSA / FRA / FTA
One of the most important parts of the pre-trade plan is identifying after we enter the trade where is they area price is most likely to move straight into first and MOST IMPORTANTLY the area it is most likely to either find support / resistance / trouble at and potentially reverse at.
These levels are known as;
- First Support Area – FSA
- First Resistance Area -FRA
- First Trouble Area – FTA
What are These Levels?
This first area of Support may be made up of a really solid and proven area or it may be just the few previous candle highs or lows all matching up to form an area price will struggle to break.
However; depending on how important the area is depends on how we might manage our trade.
THIS IS WHAT IS THE ABSOLUTELY IMPORTANT PART:
When a trade goes to these areas we have 4 choices:
- Move the whole position to a break even trade
- Move half to break even and take half profit (or possibly a 1/3 or a 1/4)
- Take full profit
- Do nothing
Now we know what our options are we must learn to spot the areas that could possibly act as Support to our trade and manage our trades accordingly.
Examples of First Support Area
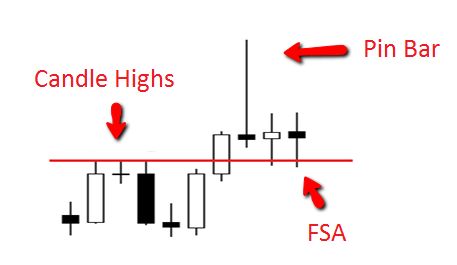
This chart shows a large pin bar with a really close First Support Area (FSA). Price breaks the low of the pin bar and moves into the FSA and it is at this level traders would be presented with the four options.
Our first support area for this trade is the three previous candle highs that are matching and were acting as resistance before price broke through higher.
It is a good chance now that when the pin bar breaks lower that price will also respect these candle highs again. This first support area is not a major area compared to other Support and Resistance we may come across, however; it can still turn price all the same and it pays to manage our trades accordingly.
Chart Example #1:
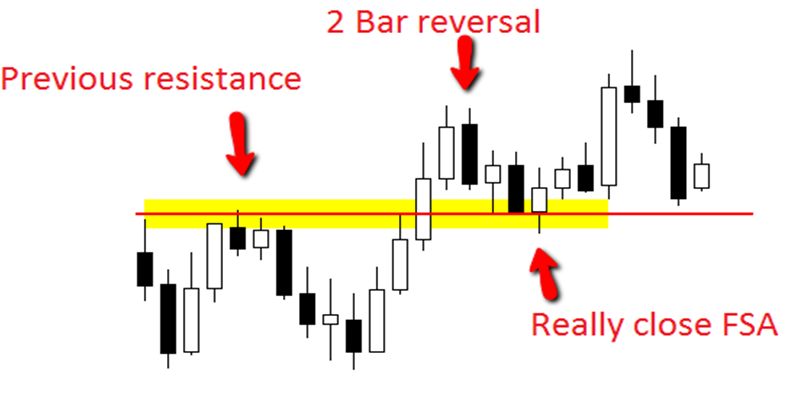
The next example is of a bearish 2 bar reversal. This chart shows price trading straight into a very close FSA area.
This is a great example of where some traders will pass on the trade because the FSA is too close and other traders will take the trade and move to break even really quickly and see if price can move through the traffic and if they can get a runner and big winner.
There is no wrong or right answer as long as capital is protected and both traders go into the trade with their eyes wide open as to what is happening on the chart and not oblivious to these key price action levels.
Chart Example #2:
 [/text_block][/op_liveeditor_element]
[op_liveeditor_elements][/op_liveeditor_elements]
[op_liveeditor_element data-style=””]

[/op_liveeditor_element]
[op_liveeditor_element data-style=””][text_block style=”style_1.png” align=”center” font_size=”25″ font_font=”Source%20Sans%20Pro” font_style=”bold”]
Module Ten
[/text_block][/op_liveeditor_element]
[op_liveeditor_elements][/op_liveeditor_elements]
[op_liveeditor_element data-style=””][text_block style=”style_1.png” align=”left” bottom_margin=”10″]Duration: 10 mins[/text_block][/op_liveeditor_element]
[op_liveeditor_element data-style=””][text_block style=”style_1.png” align=”left” bottom_margin=”10″]Module Progress:[/text_block][/op_liveeditor_element]
[op_liveeditor_element data-style=””]
[/op_liveeditor_element]
[op_liveeditor_element data-style=””]
[/op_liveeditor_element]
[op_liveeditor_element data-style=””][text_block style=”style_1.png” align=”center” top_padding=”6″]« Previous Lesson[/text_block][/op_liveeditor_element]
[op_liveeditor_elements][/op_liveeditor_elements]