
[op_liveeditor_element data-style=””]
LESSON: Correlation in Forex
[/op_liveeditor_element]
[op_liveeditor_element data-style=””][text_block style=”style_1.png” align=”left” font_size=”16″ font_font=”Montserrat” font_color=”%237e7e7e”]Correlation in the Forex market is the relationship between two pairs moving in the similar direction over a period of time. You can also have correlation where one pair mimics the other pair’s direction but inversely.
For example; it is widely known that the EURUSD and GBPUSD tend to move in the same direction over a period of time.
The best time frame to see correlation in play is from a daily time frame. Correlation levels vary from timeframe to timeframe. The GBPUSD and EURUSD may be highly correlated on the daily time frame, but not as closely correlated on a 5 min time frame.
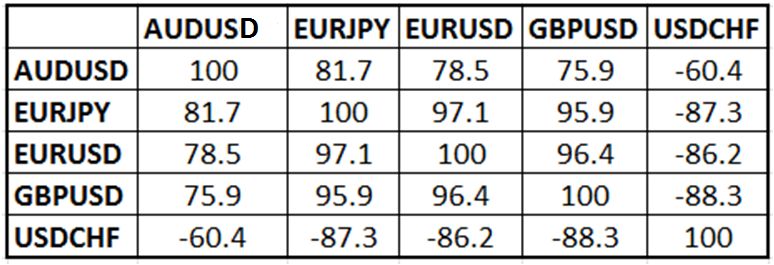
Inverse correlation works when one Forex pair moves inversely at a similar rate to another pair over a period of time. For example EURUSD and USDCHF are inversely correlated. So when the EURUSD moves higher there is a strong chance that the USDCHF will move in the opposite direction which would be down.
The following graph highlights the correlations from a previous time, between the major Forex pairs. Keep in mind correlation values are always changing depending on what the market is doing. Even though 2 pairs may be highly correlated today, that does not mean they will be, in 5 years to come!
The following graph is not a representation of the correlations at the present time, and is only for example purposes.
NOTE: The numbers with – beside them are showing inverse correlation between the two pairs.
Daily Chart Correlation Graph
[/text_block][/op_liveeditor_element]
[op_liveeditor_elements][/op_liveeditor_elements]
[op_liveeditor_element data-style=””]

[/op_liveeditor_element]
[op_liveeditor_element data-style=””][text_block style=”style_1.png” align=”center” font_size=”25″ font_font=”Source%20Sans%20Pro” font_style=”bold”]
Module Twelve
[/text_block][/op_liveeditor_element]
[op_liveeditor_elements][/op_liveeditor_elements]
[op_liveeditor_element data-style=””][text_block style=”style_1.png” align=”left” bottom_margin=”10″]Duration: 5 mins[/text_block][/op_liveeditor_element]
[op_liveeditor_element data-style=””][text_block style=”style_1.png” align=”left” bottom_margin=”10″]Module Progress:[/text_block][/op_liveeditor_element]
[op_liveeditor_element data-style=””]
[/op_liveeditor_element]
[op_liveeditor_element data-style=””]
[/op_liveeditor_element]
[op_liveeditor_element data-style=””][text_block style=”style_1.png” align=”center” top_padding=”6″]« Previous Lesson[/text_block][/op_liveeditor_element]
[op_liveeditor_elements][/op_liveeditor_elements]