
[op_liveeditor_element data-style=””]
LESSON: Breakouts with Inside Bar (BOIB)
[/op_liveeditor_element]
[op_liveeditor_element data-style=””][text_block style=”style_1.png” align=”left” font_size=”16″ font_font=”Montserrat” font_color=”%237E7E7E”]The breakout with inside bar is very similar to the breakout with Engulfing bar. In both setups we are waiting for price to close out of the breakout area and then using price to give us an entry to trade with the momentum.
Quite often when there is a breakout, price will push out very hard and fast and the next candle will pause. This candle will do very little and price will consolidate. This normally ends up with price forming an inside bar.
The reason this normally occurs is because price breaks out with a flurry of quick orders and then traders start to take profit. It then takes a little while for the orders to build up again before price explodes lower. For this reason the second move after the initial breakout can very often be the bigger of the two moves and we can take advantage of this one.
The best time frame to enter the BOIB is on the:
- Daily chart
- 4hr Chart
Once we have identified a breakout has occurred we need to first ensure price has closed outside of the breakout area. This is again very important.
Once price has broken out, we are looking for that old support or resistance area of the breakout to hold as a new support or resistance area. If price has broken and CLOSED outside the breakout is still a potential breakout and price could still be contained.
After we have identified price has broken out we are looking for an inside bar to form. This next point is super important:
THE INSIDE BAR MUST CLOSE OUTSIDE THE OLD BREAKOUT AREA! IF PRICE GOES AND CLOSES BACK INSIDE THE BREAKOUT AREA THE TRADE IS INVALID AND WE MOVE ON.
CHART EXAMPLE #1:
An example of price breaking out and then the inside bar closing back inside the old breakout area is below. This would make the trade invalid as we would now expect the breakout area to hold again. As said earlier we never enter a trade and hope the breakout will occur!
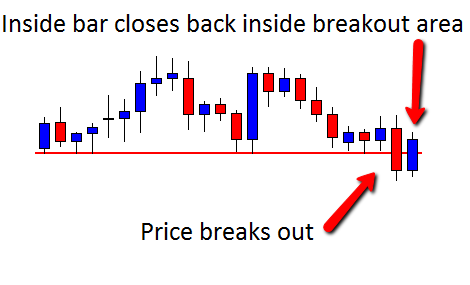
Because the inside bar on the chart above closes back inside the breakout area we class the breakout as a fake out and would now expect the support of the breakout area to hold.
For a BOIB to be a good trade we need a solid break and then an Inside Bar to form. The very best trades will see the inside bar go to test the old breakout area and then close back outside.
Entry on the BOIB is always at the break of the breakout bar NOT the inside bar. We need to see the breakout bars low/high taken out to confirm the breakout and trade.
Where to Place Stops
The stop for this breakout setup can be either of three ways:
- On the other side of the inside bar
- On the other side of the Housing candle. (The housing candle is the candle before the inside bar that “houses” the inside bar.
- On the other side of the breakout area. For example if price has broken out of resistance you could place your stop under the resistance level. This is the safest stop as price then has to re-break the breakout area to take your stop
CHART EXAMPLE #2:
An example of a good BOIB setup is below. On this occasion price broke out to the upside and then formed an inside bar. Entry on this trade would be on the break of the first bar of the inside bar formation.
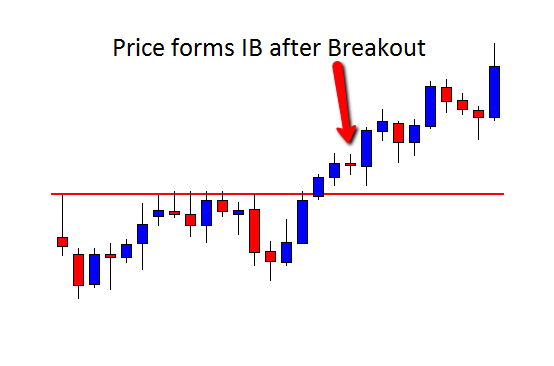
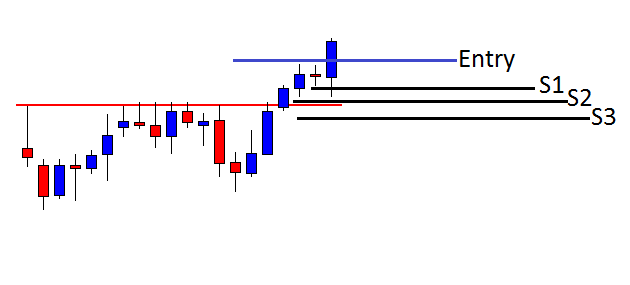
CHART EXAMPLE #3:
An example of how you could play the stop and entry on this trading strategy is below:
- S1: Stop 1 is below the inside bar
- S2: Stop 2 is below the housing bar
- S3: Stop 3 is below the resistance area.
 [/text_block][/op_liveeditor_element]
[op_liveeditor_elements][/op_liveeditor_elements]
[op_liveeditor_element data-style=””]

[/op_liveeditor_element]
[op_liveeditor_element data-style=””][text_block style=”style_1.png” align=”center” font_size=”25″ font_font=”Source%20Sans%20Pro” font_style=”bold”]
Module One
[/text_block][/op_liveeditor_element]
[op_liveeditor_elements][/op_liveeditor_elements]
[op_liveeditor_element data-style=””][text_block style=”style_1.png” align=”left” bottom_margin=”10″]Duration: 8 mins[/text_block][/op_liveeditor_element]
[op_liveeditor_element data-style=””][text_block style=”style_1.png” align=”left” bottom_margin=”10″]Module Progress:[/text_block][/op_liveeditor_element]
[op_liveeditor_element data-style=””]
[/op_liveeditor_element]
[op_liveeditor_element data-style=””]
[/op_liveeditor_element]
[op_liveeditor_element data-style=””][text_block style=”style_1.png” align=”center” top_padding=”6″]« Previous Lesson[/text_block][/op_liveeditor_element]
[op_liveeditor_elements][/op_liveeditor_elements]