
[op_liveeditor_element data-style=””]
LESSON: How to Trade Ranging Markets
[/op_liveeditor_element]
[op_liveeditor_element data-style=””][text_block style=”style_1.png” align=”left” font_size=”16″ font_font=”Montserrat” font_color=”%237e7e7e”]When trading ranging markets we must ensure we are playing our trades from extremely good Support and Resistance areas on the chart.
We don’t want to be getting caught taking trades anywhere in the middle of a ranging consolidating choppy no man’s area.
There is a difference between a clear ranging market with a clear high and low, and a very choppy market. Really choppy markets that do not have a clear high and low really need to be avoided as they can tend to whipsaw even at the best of times.
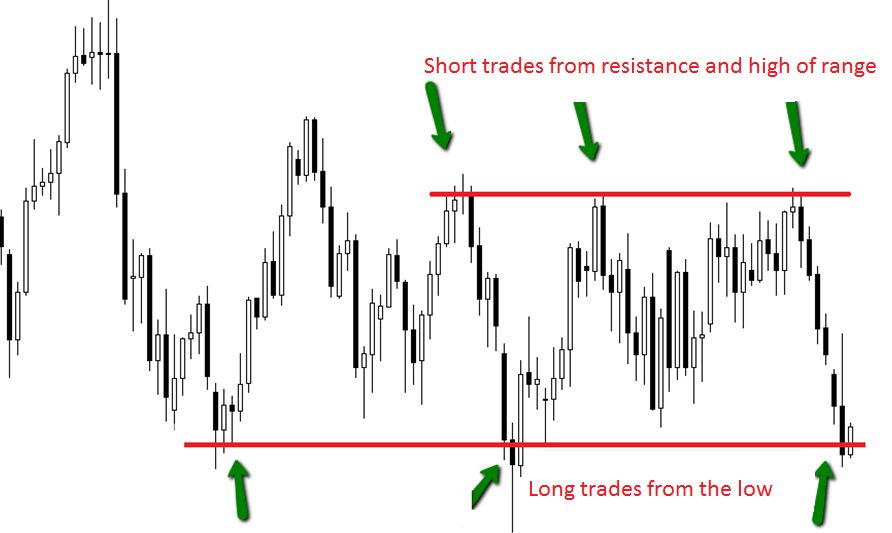
Chart Example:
Chart example below shows where possible trades could be taken from inside this range.
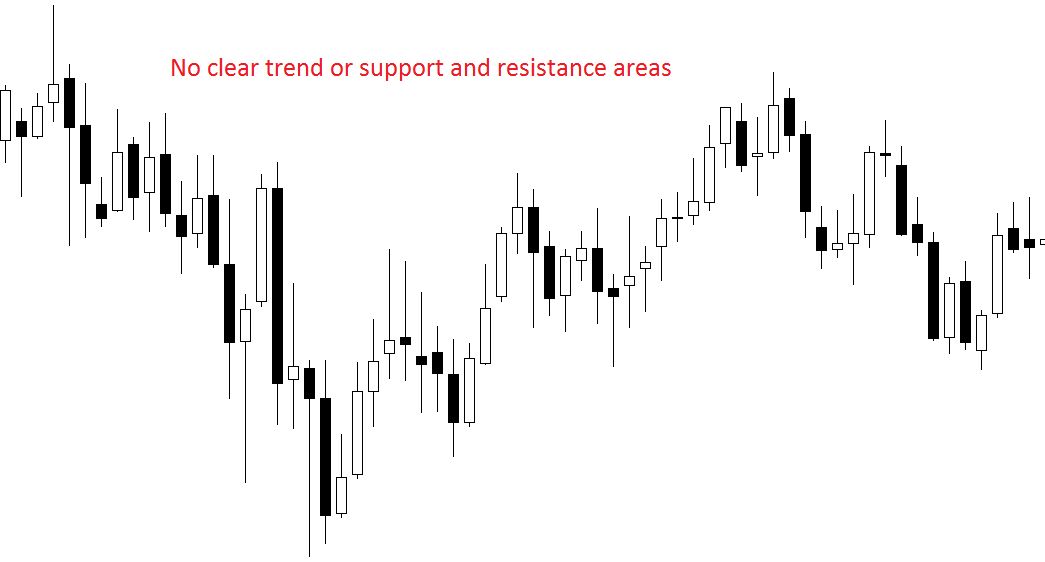
An example of a really choppy market that does not have any clear highs or low in place and should be avoided.
Mid-way Point
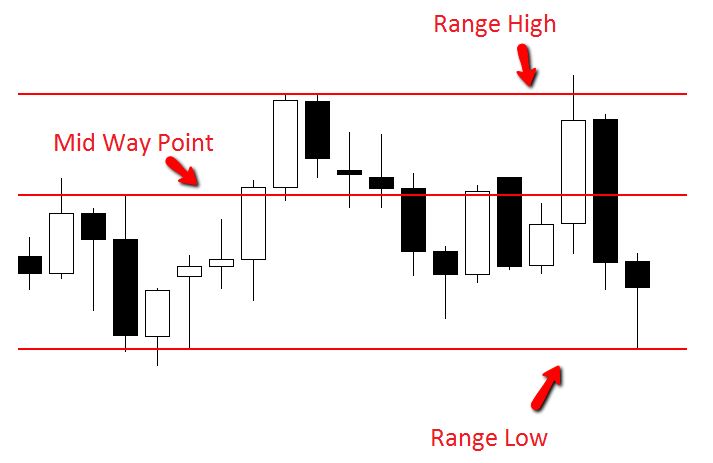
Whilst the ranges are best traded from the highs and lows, traders need to learn about what is known as the mid way point because this is often where price will chop and whipsaw.
Most range areas will have a mid way point and this is an area that is as it suggests somewhere in the middle of the high and the low of the range.
Whilst to the newer traders these can sometimes be hard to spot especially because they are in traffic in the range, they can often act as a support and resistance zone and to unsuspecting traders who don’t know they are there can be whipsawed out of their trades.
The first chart above that I posted has one of these midway points and this is shown on the page below. You will notice a lot of the candles could not close below this area and they acted as support.
Once they moved below they acted as resistance and the candles could not close above.
These mid ways points can be used as part of a trader’s trade management plan. These mid points can quite often act as key support and resistance levels and once traders are more familiar with them they can begin to use them in trading situations such as a buffer between their stop and price and when trailing their stop.
Chart Example #1:
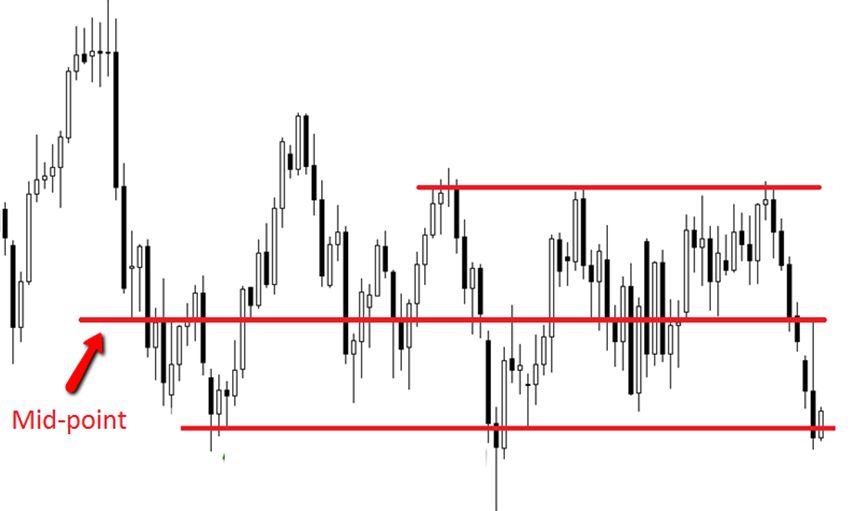
Chart Example #2:
[/text_block][/op_liveeditor_element]
[op_liveeditor_elements][/op_liveeditor_elements]
[op_liveeditor_element data-style=””]

[/op_liveeditor_element]
[op_liveeditor_element data-style=””][text_block style=”style_1.png” align=”center” font_size=”25″ font_font=”Source%20Sans%20Pro” font_style=”bold”]
Module Three
[/text_block][/op_liveeditor_element]
[op_liveeditor_elements][/op_liveeditor_elements]
[op_liveeditor_element data-style=””][text_block style=”style_1.png” align=”left” bottom_margin=”10″]Duration: 8 mins[/text_block][/op_liveeditor_element]
[op_liveeditor_element data-style=””][text_block style=”style_1.png” align=”left” bottom_margin=”10″]Module Progress:[/text_block][/op_liveeditor_element]
[op_liveeditor_element data-style=””]
[/op_liveeditor_element]
[op_liveeditor_element data-style=””]
[/op_liveeditor_element]
[op_liveeditor_element data-style=””][text_block style=”style_1.png” align=”center” top_padding=”6″]« Previous Lesson[/text_block][/op_liveeditor_element]
[op_liveeditor_elements][/op_liveeditor_elements]