
[op_liveeditor_element data-style=””]
LESSON: Breakouts Using Price Action on Smaller Time Frames (BO1)
[/op_liveeditor_element]
[op_liveeditor_element data-style=””][text_block style=”style_1.png” align=”left” font_size=”16″ font_font=”Montserrat” font_color=”%237E7E7E”]When trading the price action methods from the price action course we are quite often looking for areas to break and then quickly retrace to give us a chance to get into the trade.
This sort of setup is a very high probability and can present with a very good risk reward scenario. Quite often we are looking for trades on the daily and 4hr charts.
Very Similar…
The method behind BO1 is similar to the breakout and retraces method that we already use from the price action course #1; however there are some key rule changes.
Essentially we are waiting for the same sequence to occur. We are waiting for price to break out of a key area of either consolidation or wind up pattern and then retrace back to the old support or resistance area for us to then make a trade.
An example of the pattern already taught is below:
CHART EXAMPLE #1:
With this new breakout method we are looking to cut out all the time in between waiting for price to retest.
We are looking to get into the move that is the breakout.
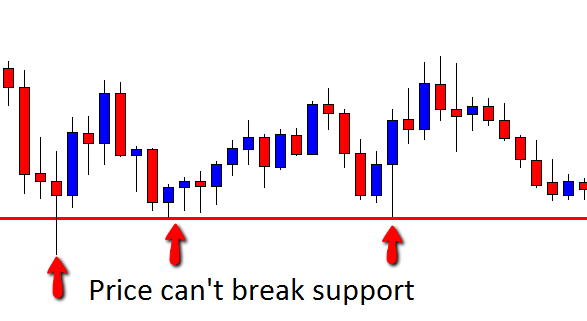
The first stage of looking for any breakout trade is to first notice price either stuck in a wind up pattern or being held by a support or resistance area. Below are examples of both price ranging and being held by a key level.
CHART EXAMPLE #2:
Price Winding up (The trend lines are for example only)
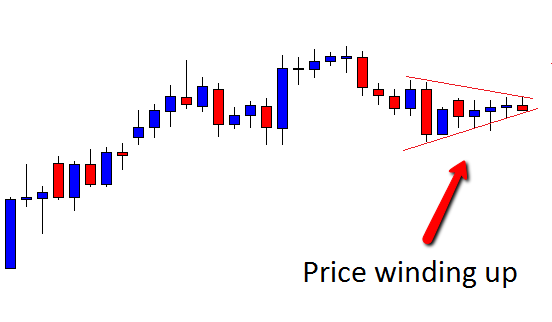
CHART EXAMPLE #3:
Price being held by support area
After we have spotted price getting ready for a breakout the next step is to simply wait for the initial breakout to occur.
We DO NOT enter any trades hoping that price will breakout. All breakout methods are trading once price has broken out.
We are never pre-empting what the market may do. We let the market show its hand and then jump on board!
Trade Time Frames:
We are looking for the breakout setup on:
- Daily chart
- 4hr Chart
This means that on the daily and 4hr charts we are marking our levels and looking for price to wind up.
Once price does breakout we are looking to enter trades on the:
- 1hr Chart
As I said earlier we are looking to get into the breakout move. The aim of this breakout is not to wait around for days or weeks for price to move higher or lower and then retest the breakout level. We are trying to get on board the explosive move that is the breakout.
When we have noticed the breakout occurring on our daily or 4hr chart we then need to move down to the 1hr chart to start watching price action. Here is where it can tricky!
CHART EXAMPLE #4:
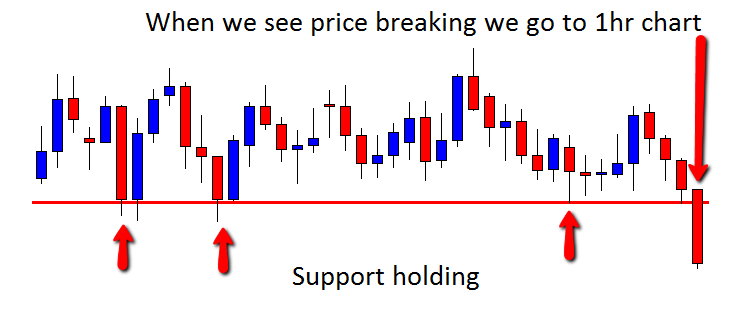
The chart below is a daily chart. This is where we are marking our levels and watching and waiting for a breakout to occur.
When we notice price may be breaking out in this chart we go down to the 1hr chart.
Once on the 1hr chart we need to see price break the key level and then close out. So if price was breaking a resistance zone and breaking out higher we would need to see price move higher and close above the resistance area on the 1hr chart. This then confirms price has broken out.
For support like the example above we would need to see price break and close lower than the support level on the 1hr chart.
Once we have seen price close outside the breakout area we are then looking for price to retrace back to the same level. What will very often happen is price will break out hard and fast. The traders who were in on this initial breakout will then start to take profit which will then see price retrace. The retrace is what we want to see as this is what will give us a chance to enter!
CHART EXAMPLE #5:
The chart below is the 1hr chart of the same setup above. This chart clearly shows price breaking out and then closing out of the breakout area. Then price retraces to the old support level. It is here we are on the lookout for a trade to get short.
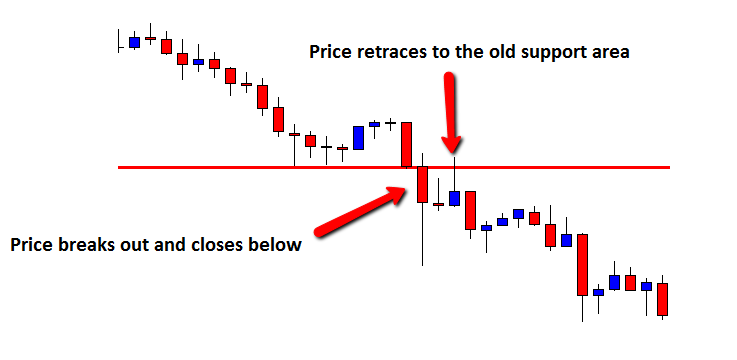
Now price is back to the breakout area we are looking for price action to get us into the trade.
Now there are some key differences in the price action signal that we can take on this trade.
We are looking for Pin Bars, Engulfing Bars or 2 Bar reversals to get into a trade. One of the main rules when playing these price action signals normally is that they must form in space and they also must stick out away from price.
When playing these price action signals in a BO1 scenario price will never be in space and it will also never stick out away from the other price because we are trying to enter without price first moving too far away.
All we are looking for when entering the BO1 is the correct psychology behind the signal. For example; we are looking for price to come back and retest the old level and then reject this level and give us a Pin Bar. This Pin Bar will not be able to form in space and away from all other price but as long as it shows us the solid rejection of the level this is fine to trade.
The key is seeing price reject the level and go back in the breakout direction! The bigger and more commanding the entry signal is, the better our chances of placing a winning trade are.
CHART EXAMPLE #6:
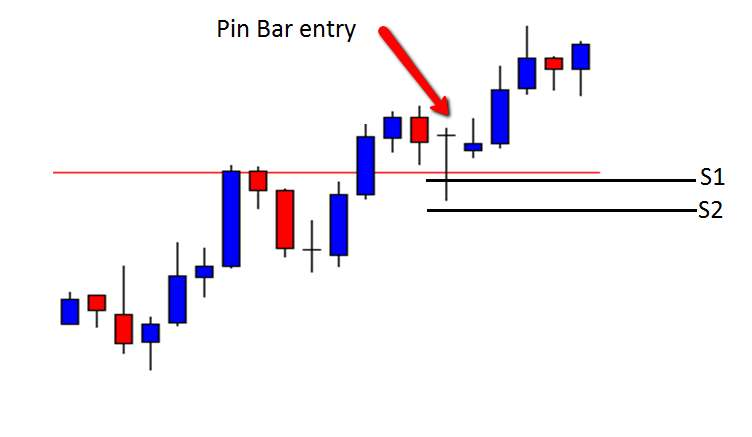
An example of a Pin Bar using the BO1 method is. Notice this Pin did not form sticking out away from price but it was still a very good Pin Bar that had a very long wick rejecting the resistance level.
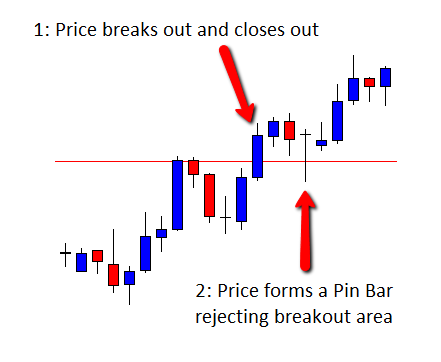
CHART EXAMPLE #7:
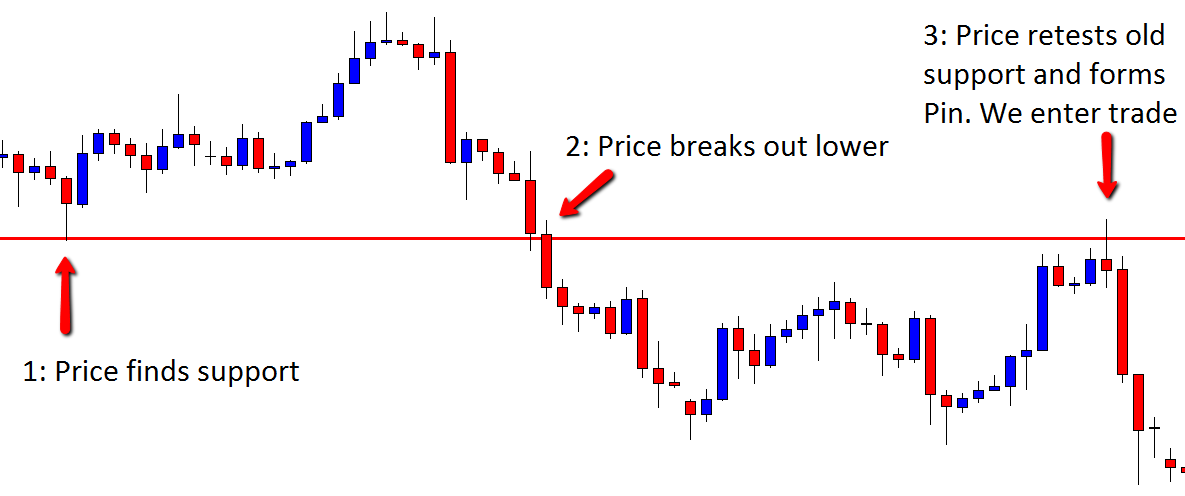
An example of how a full trade works is below. On the first chart we have a possible breakout scenario we have been monitoring on the 4hr chart. We notice price has found support and has bounced at previous attempts. We then spot price possibly breaking out to the downside and through the support area.
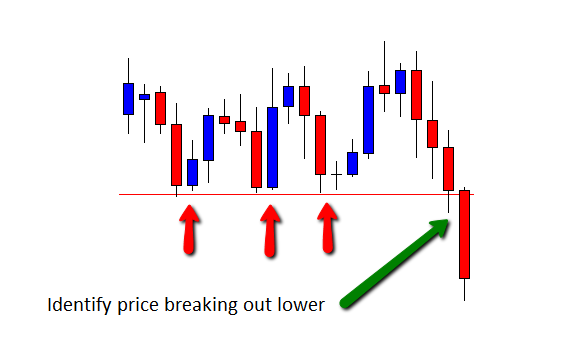
Now we have identified price breaking out lower on the 4hr chart we switch to the 1hr chart to look for a breakout entry. To confirm the breakout is not a fake out we need to first identify that price on the 1hr chart has broken lower and close below the support area. To enter a trade we are looking for a Pin Bar, 2 bar reversal or engulfing bar.
CHART EXAMPLE #8:
The following chart shows price breakout lower and close outside the breakout level. Then price retraces and forms a Pin Bar reversal. To enter this trade we follow normal rules and wait for price to break the low of the Pin bar to confirm the trade.
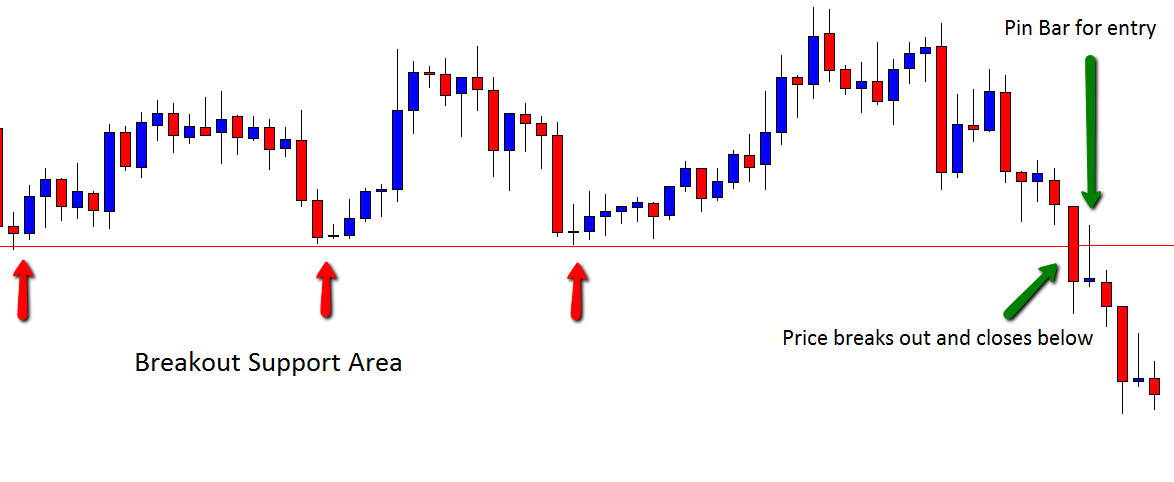
CHART EXAMPLE #9:
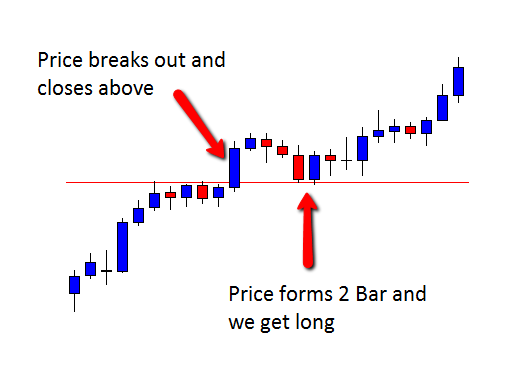
The last example is of BO1 trade to go long. On the first chart below we have price struggling to break through resistance. When we see price may be making a break higher we go down to the 1hr chart to start hunting to first make sure price breaks out and closes above the old resistance level and then for price action to get us into a trade.
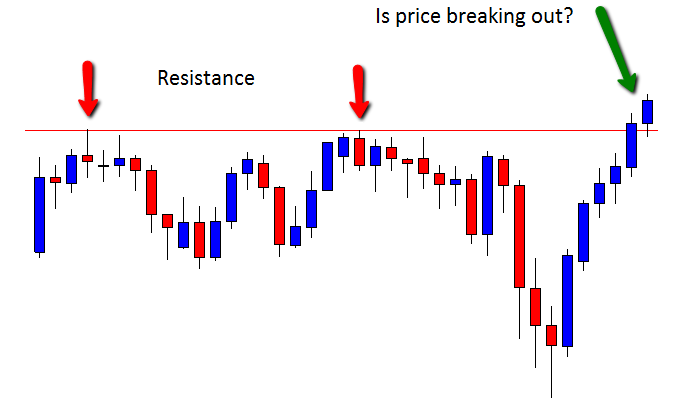
CHART EXAMPLE #10:
The next chart is the 1hr chart. In this example price moves above and closed out. The price retraced to touch the breakout area and formed a 2 Bar Reversal. This was our signal to get long. As per normal rules entry would be on the break higher of the 2 Bar.
Entry for the BO1 is using the same rules as taught in the price action course for price confirming the trade. All price actions signals including the engulfing bar must be entered when price has confirmed the signal and broken higher or lower of the signal.
There are 2 stops you can use with this breakout which are:
- Stop above/below breakout area
- Stop above/below entry signal
These stops are pretty straight forward. We normally always want to have our stop/above or below where the breakout level was because for your stop to be taken out price will have to re-break the breakout zone that we are looking to hold as support/resistance.
Placing the stop the other side of this key level will mean this level will act as a barrier to price getting your stop as much as possible. An example of both stops is below:
CHART EXAMPLE #11:
On this chart, stop 1 is below the resistance area price broke out of. We would look for this new support to act as a barrier between price and our stop. Stop 2 is below the price action signal we used to enter which is the Pin Bar.
 [/text_block][/op_liveeditor_element]
[op_liveeditor_elements][/op_liveeditor_elements]
[op_liveeditor_element data-style=””]

[/op_liveeditor_element]
[op_liveeditor_element data-style=””][text_block style=”style_1.png” align=”center” font_size=”25″ font_font=”Source%20Sans%20Pro” font_style=”bold”]
Module One
[/text_block][/op_liveeditor_element]
[op_liveeditor_elements][/op_liveeditor_elements]
[op_liveeditor_element data-style=””][text_block style=”style_1.png” align=”left” bottom_margin=”10″]Duration: 20 mins[/text_block][/op_liveeditor_element]
[op_liveeditor_element data-style=””][text_block style=”style_1.png” align=”left” bottom_margin=”10″]Module Progress:[/text_block][/op_liveeditor_element]
[op_liveeditor_element data-style=””]
[/op_liveeditor_element]
[op_liveeditor_element data-style=””]
[/op_liveeditor_element]
[op_liveeditor_element data-style=””][text_block style=”style_1.png” align=”center” top_padding=”6″]« Previous Lesson[/text_block][/op_liveeditor_element]
[op_liveeditor_elements][/op_liveeditor_elements]